SiRad Easy 300 GHz Front End Board
Contents
Please flash 300 GHz Front End firmware to Evalkit before following the steps below. You can download the firmware in our Customer Download Area (you have to register at our site).
1 Power Connection
1.1 Method 1
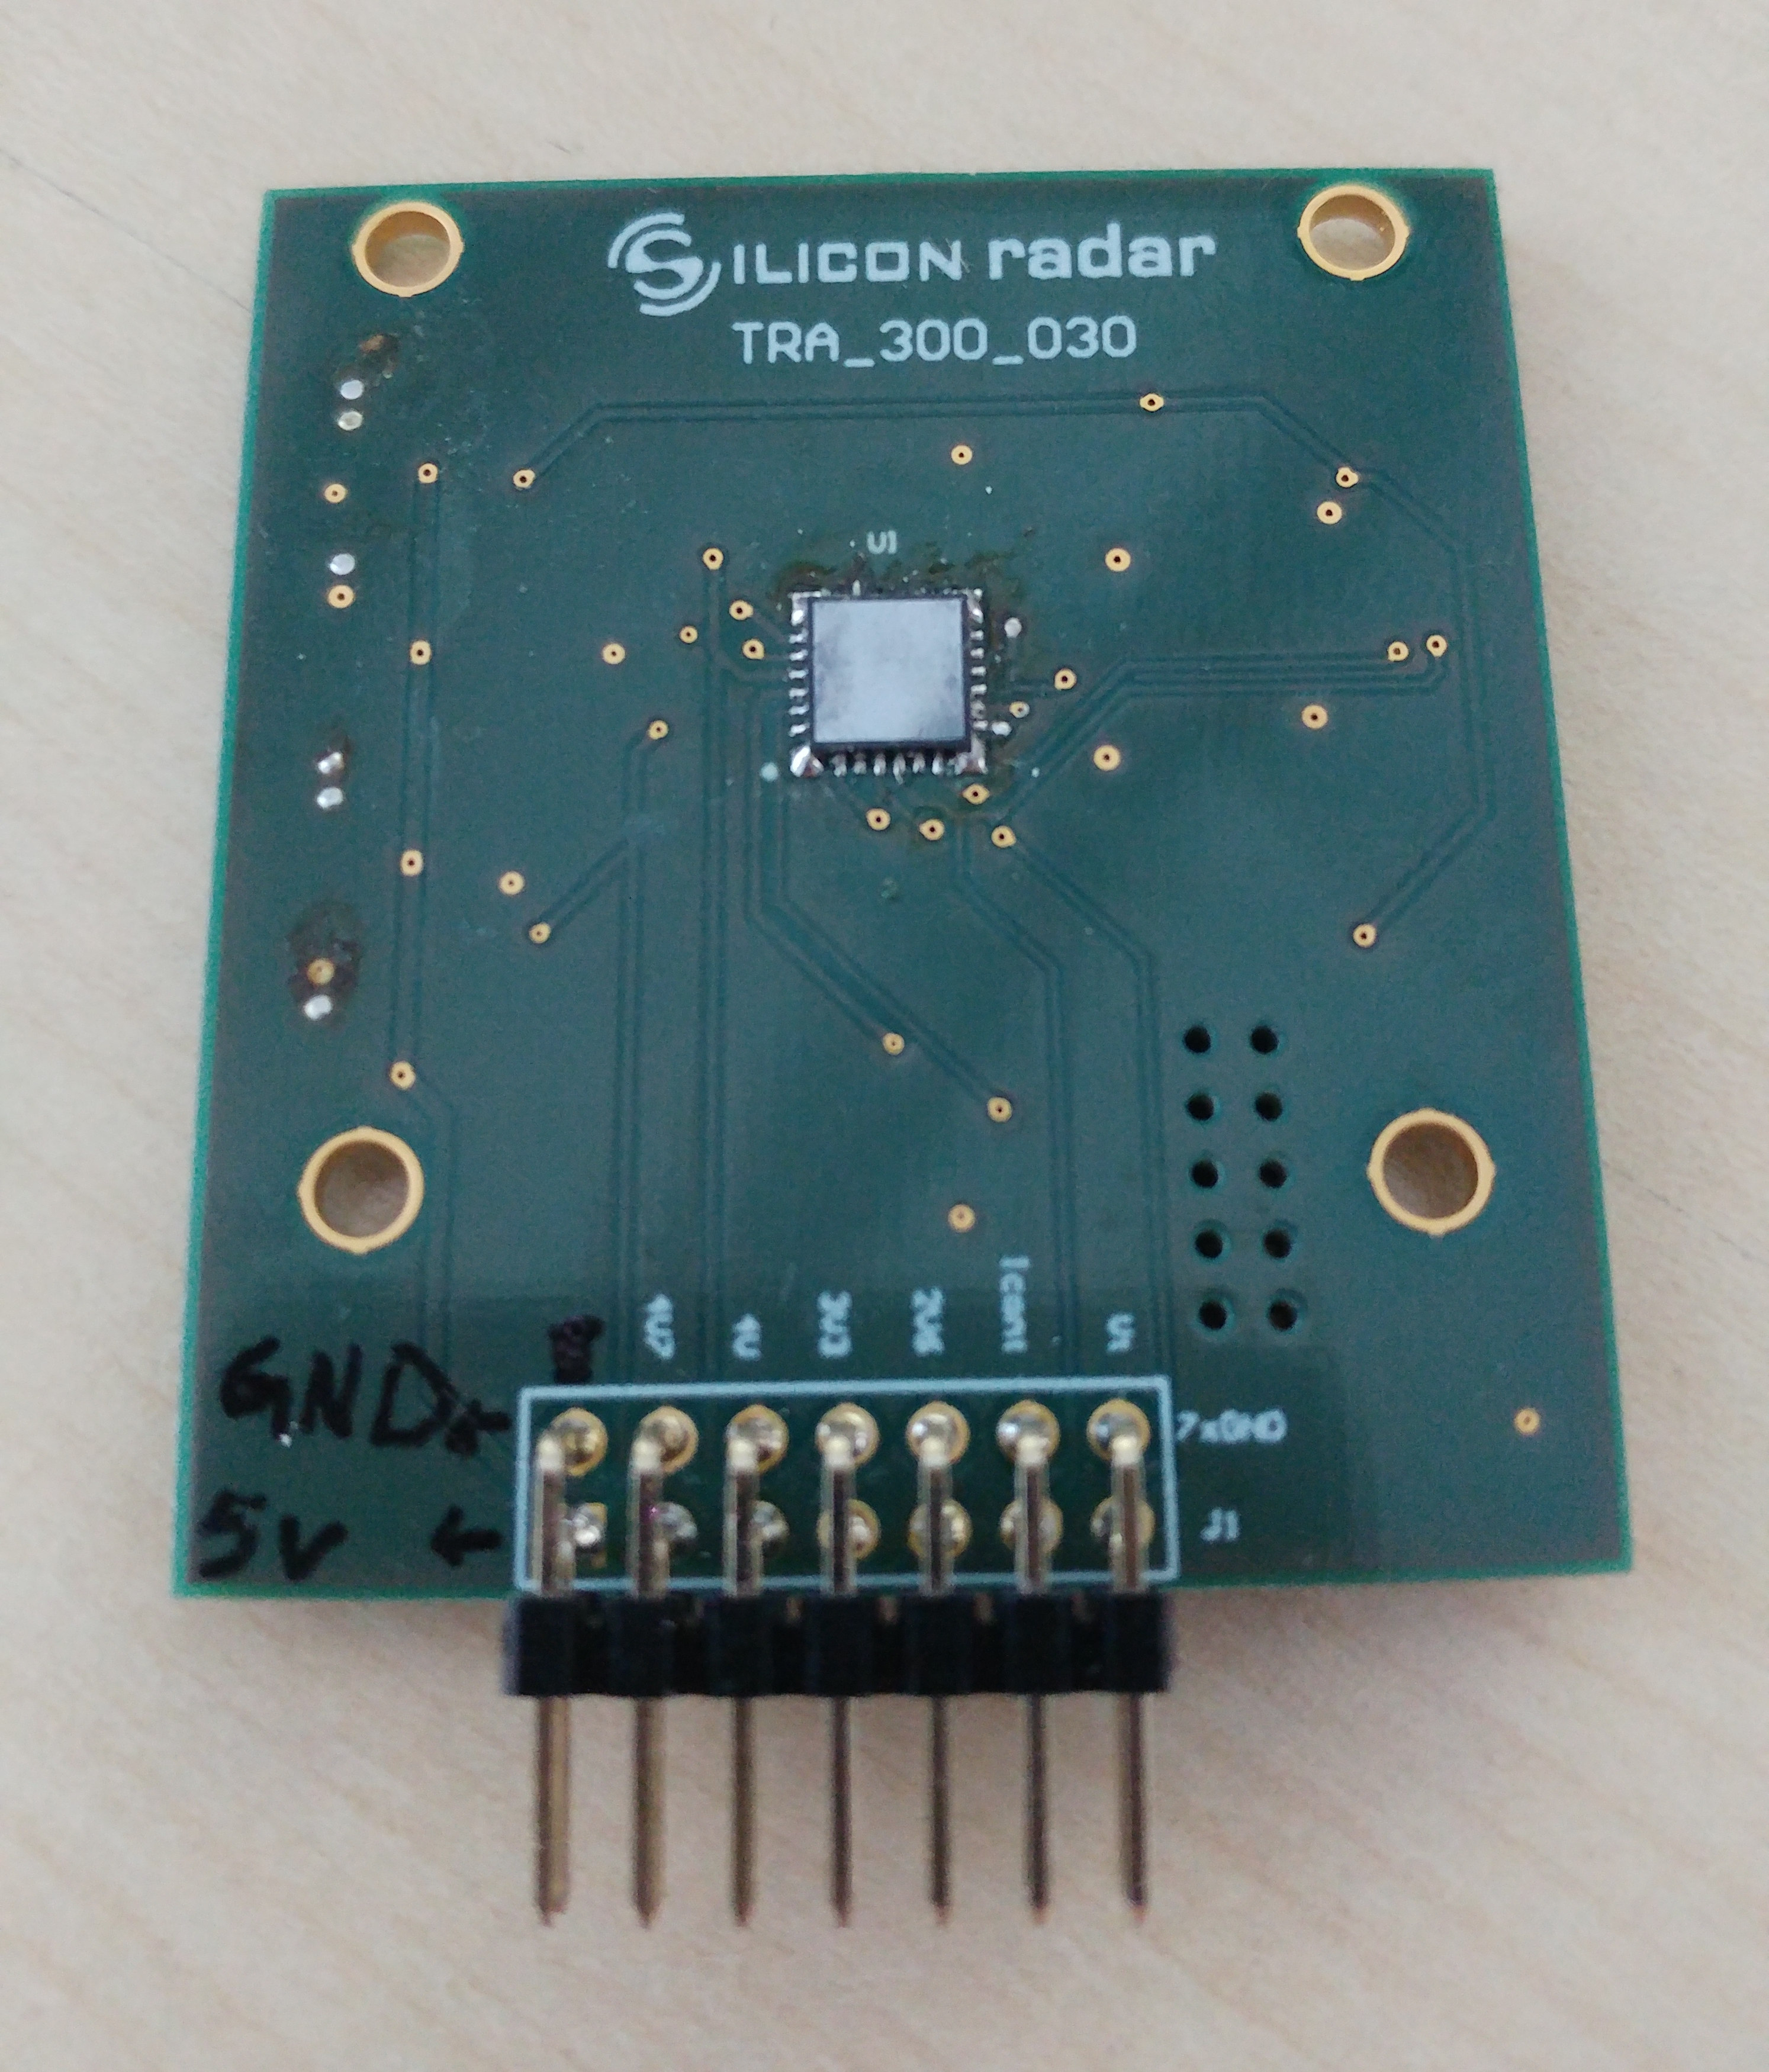
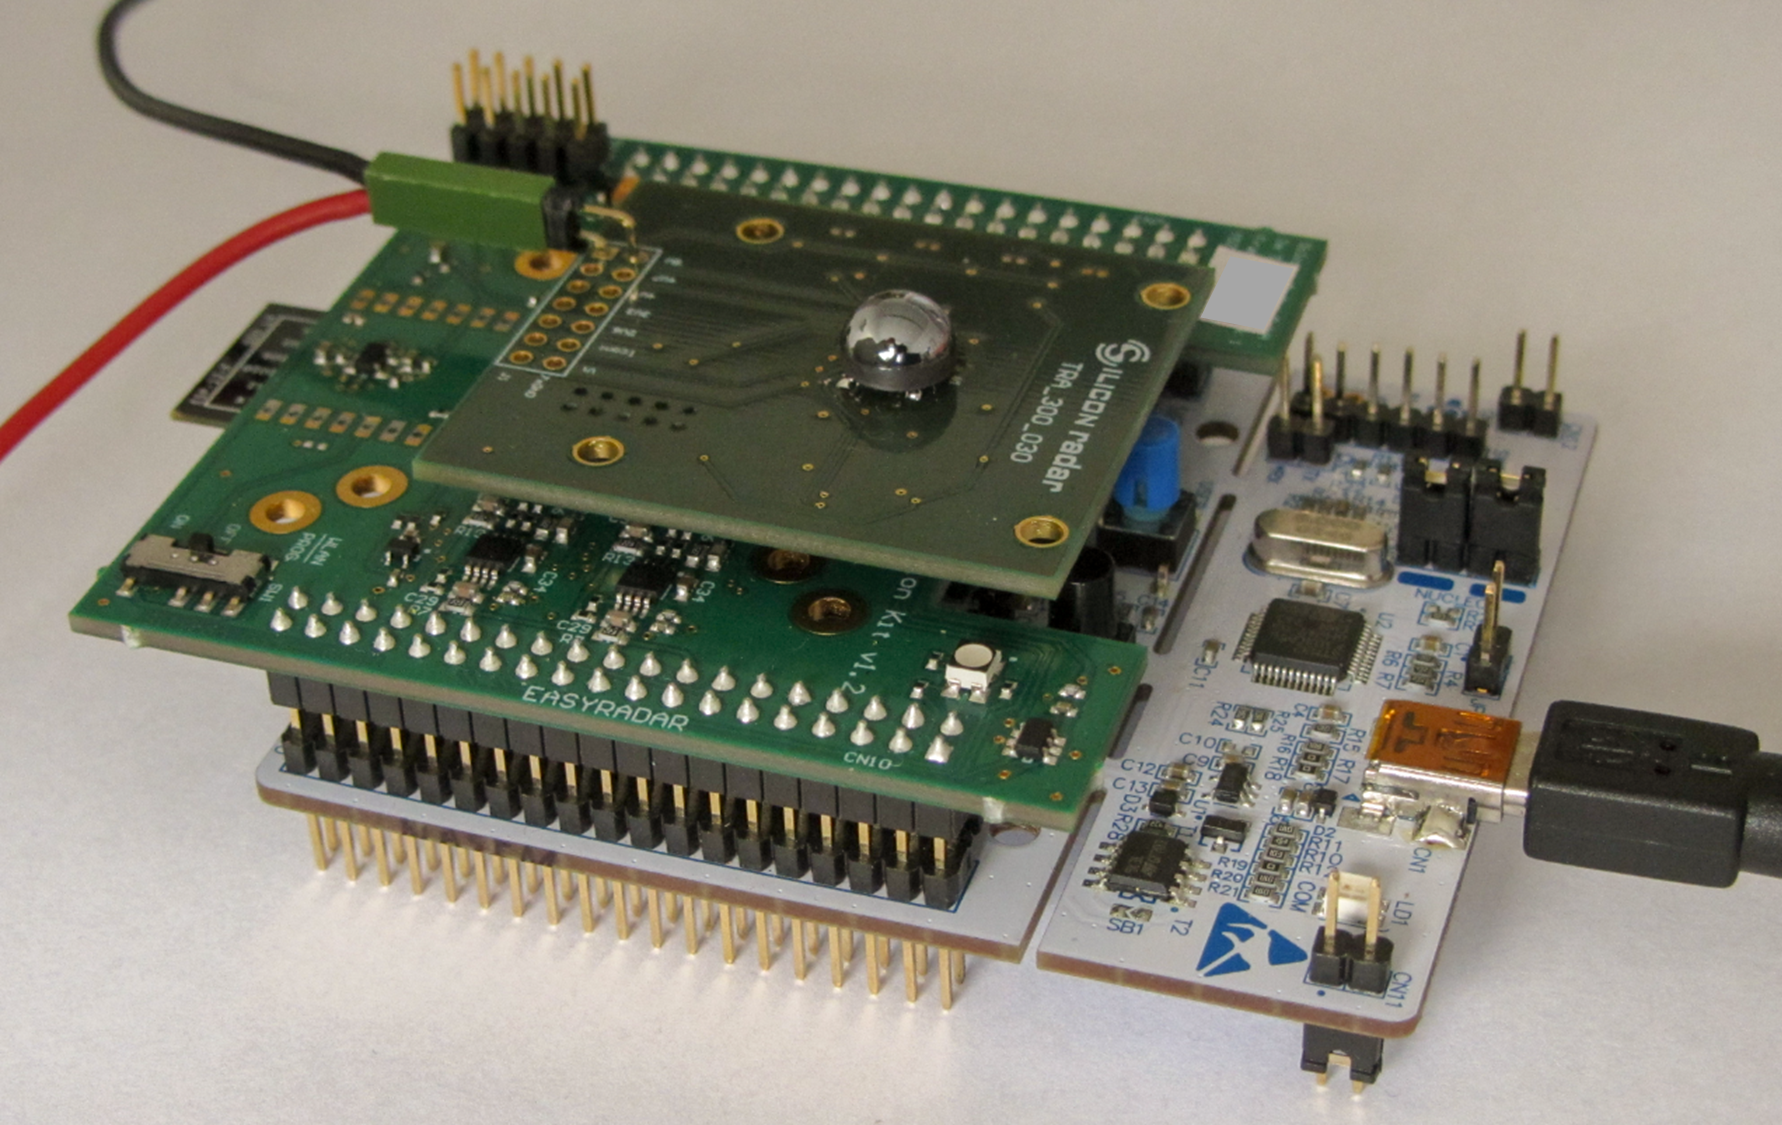
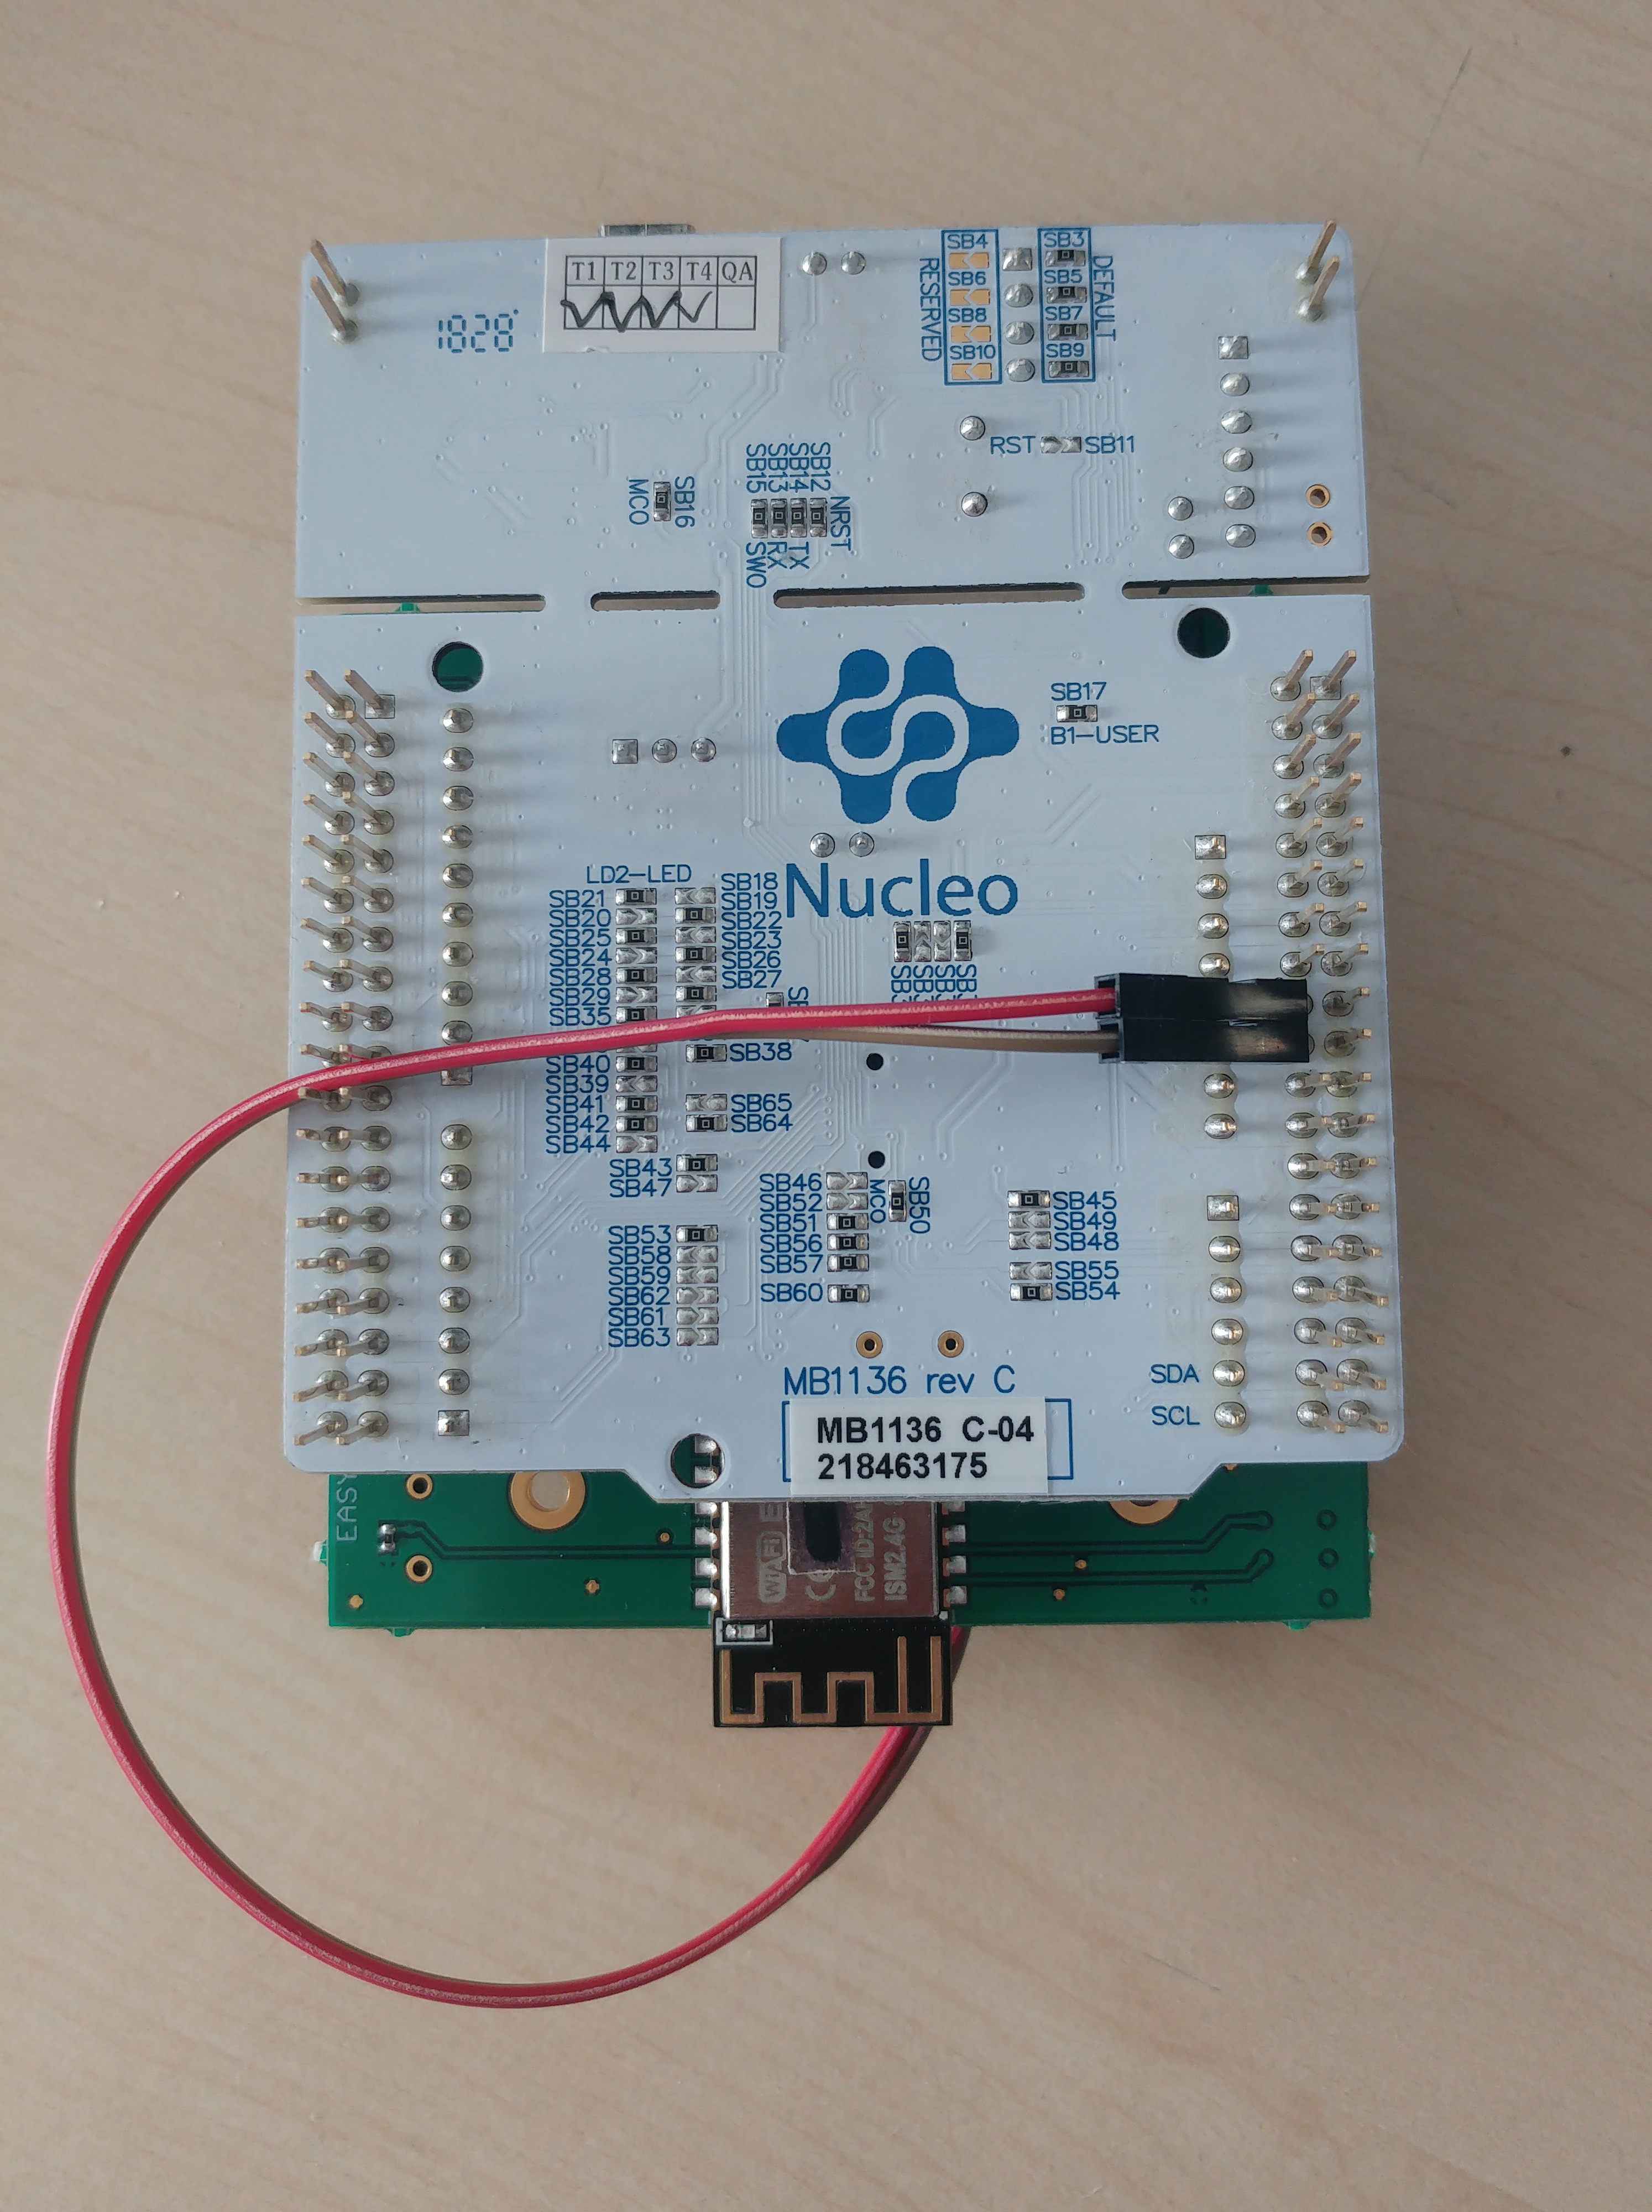
For the power supply to the front end, a separate connection is required. Figure 1 shows where to connect the power on the front end (marked in black: +5V and GND). Figure 2, shows the Easy kit with the front end mounted and connected. Figure 3 shows where to connect the power to the bottom side of the Easy: pin 18 (5V) and pin 20 (GND) of the CN7 connector on the Nucleo board. Please be aware that the 5V pin of the header bar on the Easy cannot be used to power the front end! Alternatively an external power source can be used. The supply current for the front end is 270mA (typical value).
1.2 Method 2
The front end can be also powered by an external +5V power source. For that, disconnect the Easy from the USB. Connect 5V and GND of the front end to +5V and GND of your power source, but do not power it on yet. Connect the USB again to the Easy kit. Now switch on the power of the external power source.
1.3 Method 3
Alternatively, the GND of the front end can be connected to one of the corner connectors (CN11 or CN12) of the Nucleo and the 5V of the front end can be connected to the U5V connector of the Nucleo.
2 Software Start
To launch the software evaluation platform please follow the routine described below:
- open and connect the WebGUI
- press the black reset button on the Easy Board (see Figure 2)
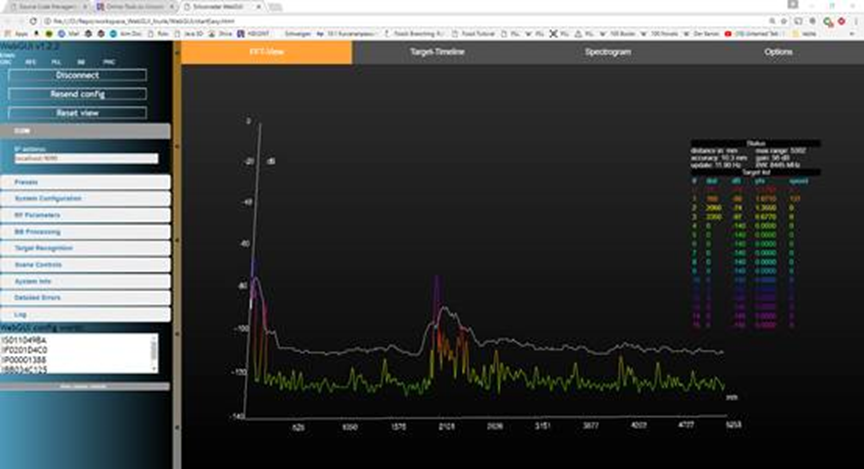
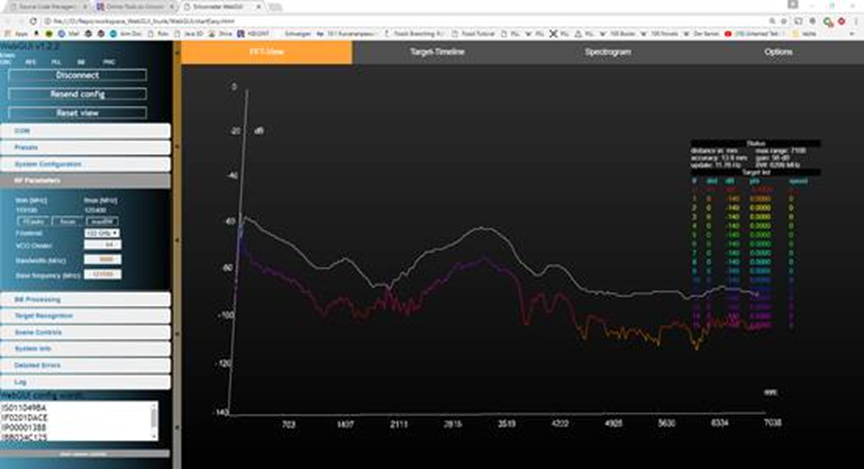
In the best case, you already have some useful output if you are pointing the radar head towards a defined target, e.g. the ceiling. In the example shown in Figure 4, this obstacle/object has a distance of around 2m, an additional peak next to the DC peak (left limit of the diagram) can be caused by the operator. This situation describes the measurement result as it should look.
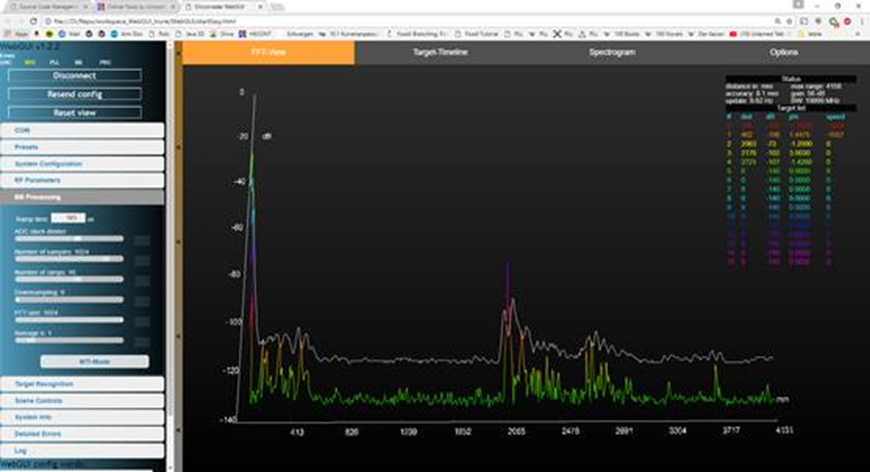
However, you may end up with a measurement graph rather similar to the one shown in Figure 5.
In such cases, the radar board operation and parameter setting need to be reviewed as described in Section 4.
3 Parameter Setting
Without depending on the measurement graph you receive, please continue with the following steps:
- RF Parameters tab
 o	Insert a Bandwidth (MHz) of 40'000 MHz
 o	Set the Base frequency (MHz) to 289'000 MHz
- BB Processing tab
 o	Adjust ADC clock divider to around 1-2ms or more (please watch the DC peaks)
 o	Adjust the Number of samples to 1024 or more
 o	Adjust FFT size to 1024
After you have performed all steps you should get an output similar to the one in Figure 6.