Evaluation
Contents
1 Selection Guide
| EvalKit | SiRad MIMO r2 | SiRad MIMO | SiRad Easy® r4 | SiRad Easy® | SiRad Simple® | Eval Boards |
| Integration of MMIC on PCB | Plug-On MIMO Evaluation Board | Plug-On MIMO Evaluation Board | Plug-On Evaluation Board | Plug-On Evaluation Board | All-in-One Evaluation Board | Stand-Alone Evaluation Board |
| PCB-Stack |
|
|
|
|
one layer – EvalBoard only | one layer – EvalBoard only |
| Target Application | Flexible and modular test set-up for investigation of use cases | Flexible and modular test set-up for investigation of use cases | Flexible and modular test set-up for investigation of use cases | Flexible and modular test set-up for investigation of use cases | Compact Test Set-up for investigation of the use case | Lab Test of MMIC parameters such as gain, linearity, … |
| Available for following MMICs | Multi-Channel [ 2x4 ] | Multi-Channel [ 2x4 ] | Single Channel | Single Channel | TRX_120_001 fixed | All 24 GHz MMICs[*2] |
| Set-Up Example | 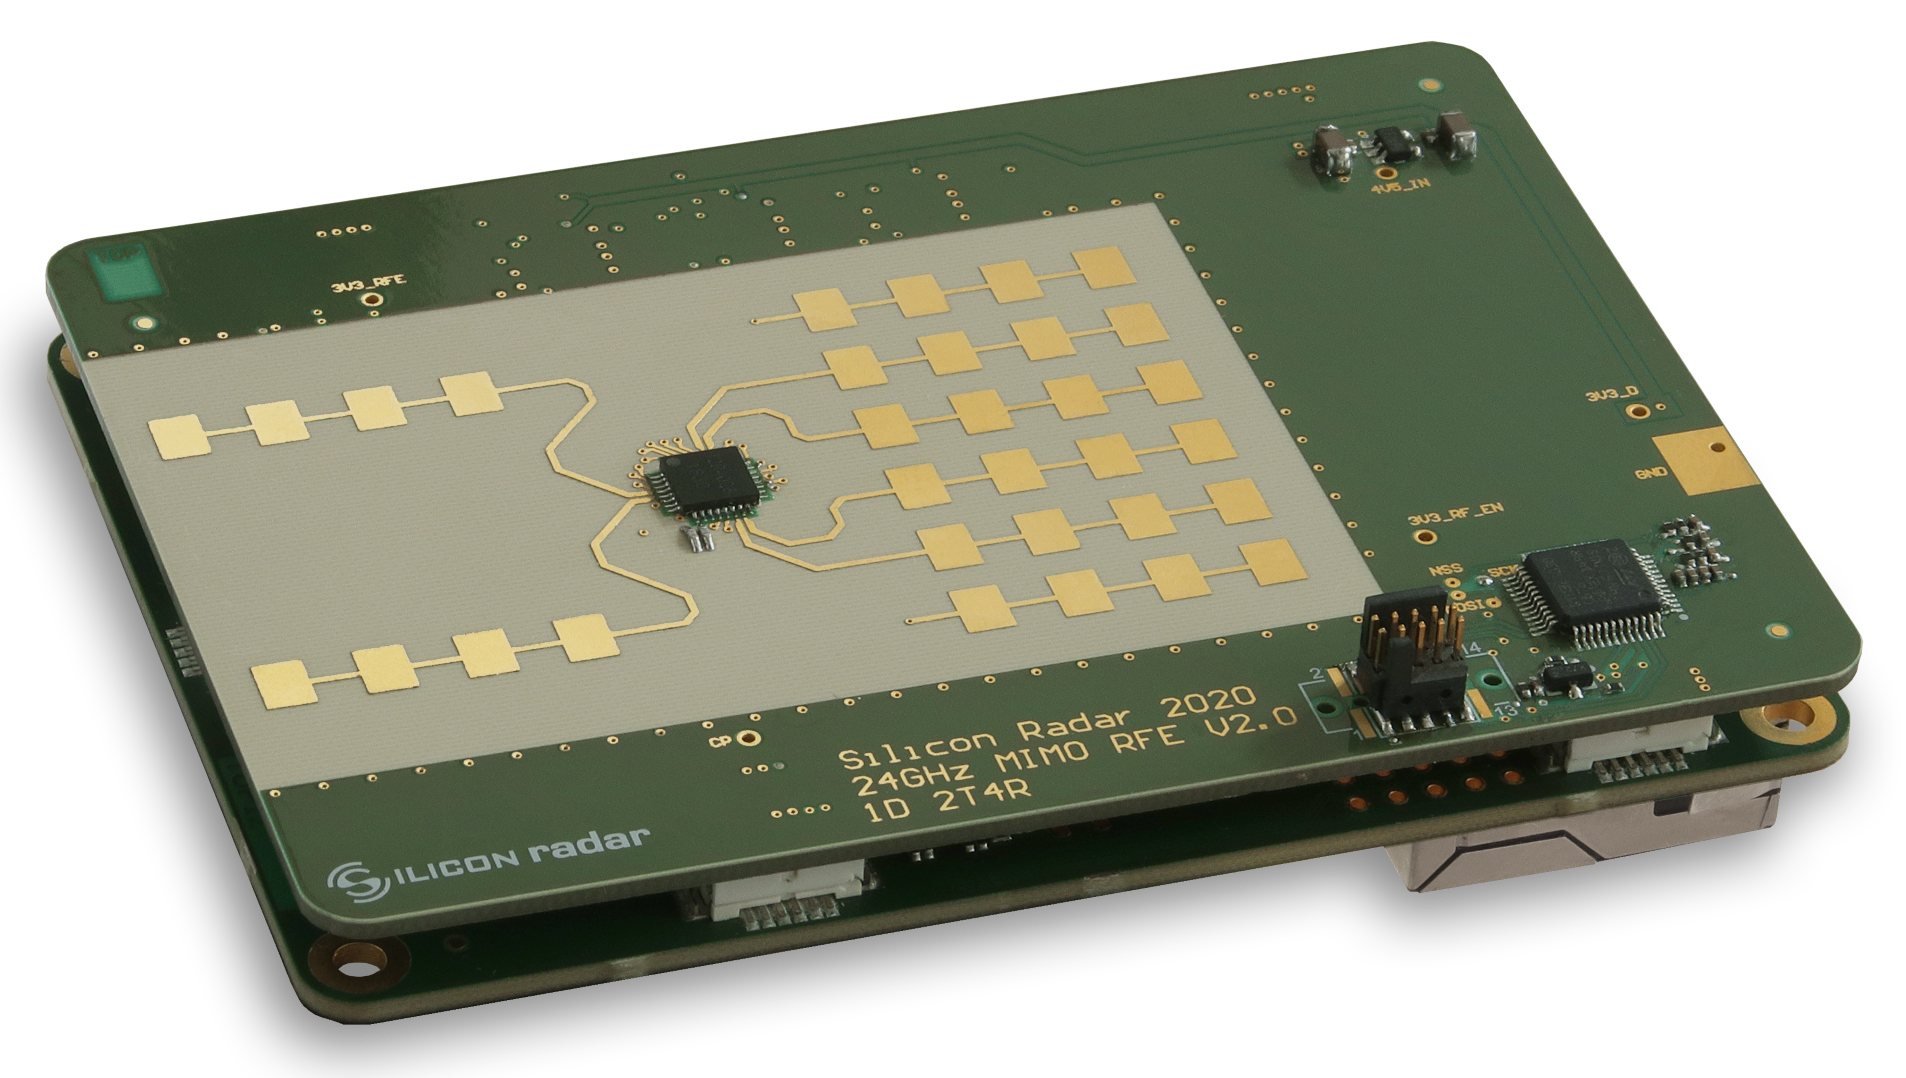
|
|

|
|
|
|
[*1] exchangeable, each MMICs requires a different Front End
[*2] lead times may apply, please inquire for details
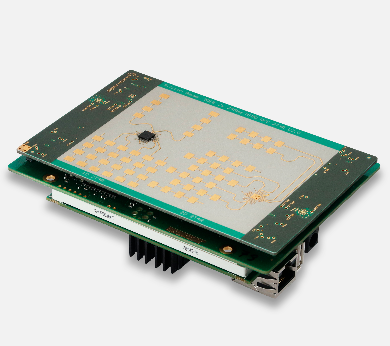
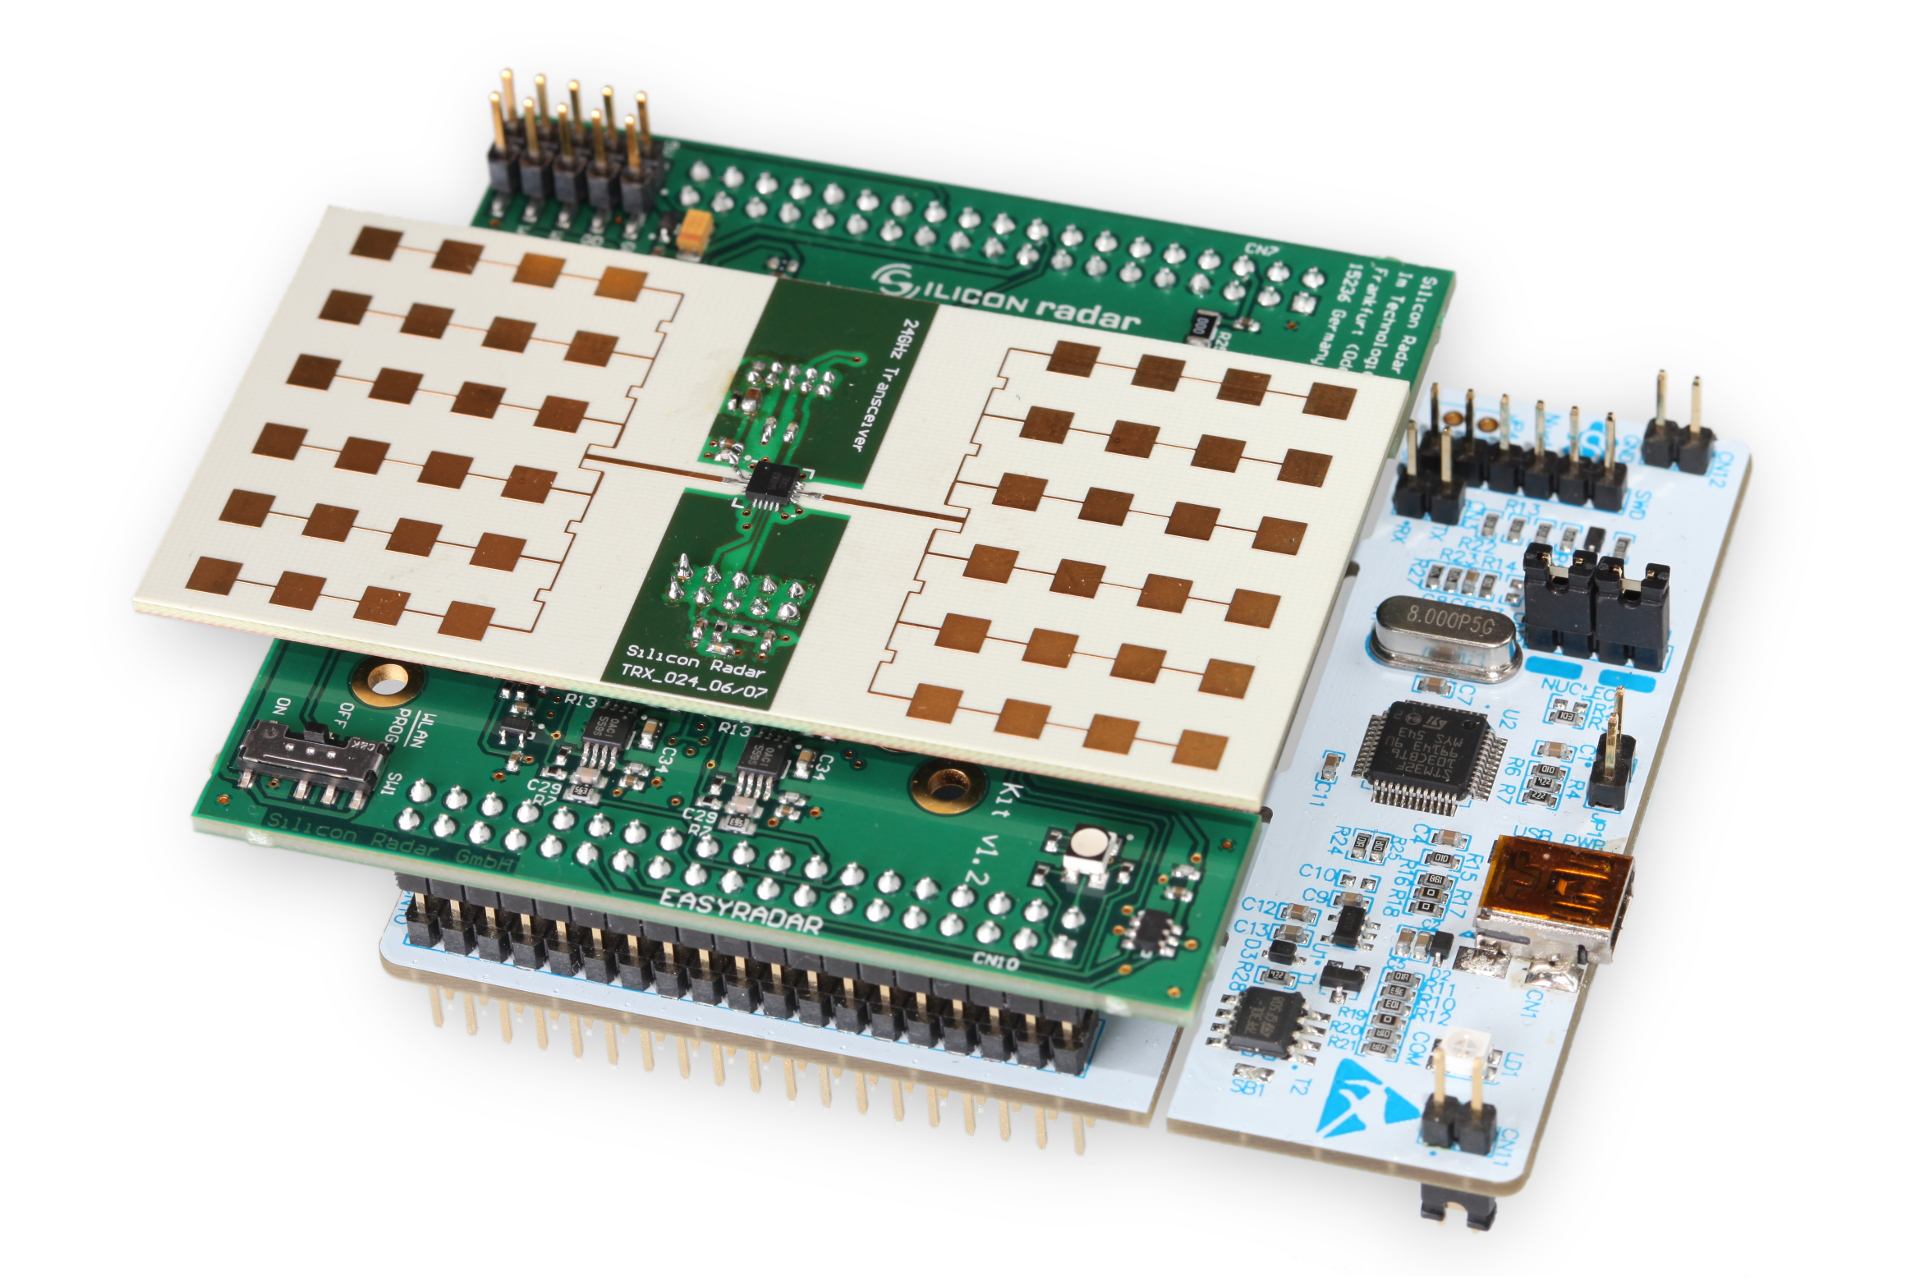
2 SiRad MIMO r2
The platform consists of two stacked boards, a universal baseband board, and an interchangeable Radar Frontend (RFE) board with a radar transceiver chip. The baseboard performs radar signals digitalization, processing, and transferring to a host computer (PC). Changing the RFE board allows the use of radar configurations with different frequency bands, antenna configurations, etc.
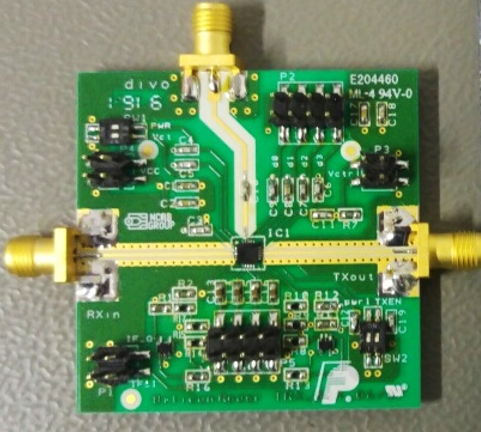
2.1 The Baseboard Design
The baseband radar signals from the chip are filtered and amplified (with user-selectable variable gain), before being sampled by two microcontrollers named iADCs (intelligent analog to digital converter). Each iADC digitizes three receive channels with a maximum sampling frequency of 2.5MHz. The iADCs capture a number of ramps from active transmit channels and thus form a “data cube” in memory. A data cube can be considered a group of digitized ramps collected from all activated transmit and receive channels on which all first level (DC cancellation, windowing, 1-D Fourier transform, target detection, etc.) and second level processing (Doppler estimation, angular estimation) takes place. It can also be viewed as the unit of data required to generate a frame in the GUI.
The iADC can be configured to output data at various points along the processing chain, for instance, raw ADC sample data, FFT output data, etc. Once ready, data is transferred to the main controller.
The main controller may perform second stage processing like various Direction of Arrival (DOA) algorithms, Doppler-Range estimation, etc. but the primary role of the main controller is sending data to a host PC for visualization and analysis. Data transmission is performed over the Ethernet interface by the UDP protocol.
A further microcontroller controls all parts of the system, generates sampling and ramp sequences, provides a command interface for system configuration and control. It is called the Housekeeper. The command interface with the housekeeper is text-based and implemented via the USB-Serial interface.
The housekeeper also interacts with the RFE board via the SPI interface to detect its type, to switch transmission antenna, and to perform some configuration.
The baseband board also integrates a PLL chip. It gets a divided RF carrier signal from the radar chip and forms a control signal to sweep (or set statically) frequencies according to the ramp sequence.
2.2 The RFE Design
The 24GHz 2TX4RX RFE board has two transmit and four receive antennas. The radar transceiver chip is controlled via SPI interface. The board has a dedicated microcontroller to control the transceiver chip and to interact with the baseboard.
Two RX channels have a full set of quadrature components (I and Q) and two channels provide only in-phase (I) components.
2.3 Triggering Description
The sample triggering process is controlled by the housekeeper controller which generates iADC sampling pulses and starts PLL sweeps according to a ramp structure. Internally the triggering process is based on a 10 MHz clock. All time intervals is taken as number of the 10 MHz clock pulses.
A simplified timing diagram of triggering process is displayed:
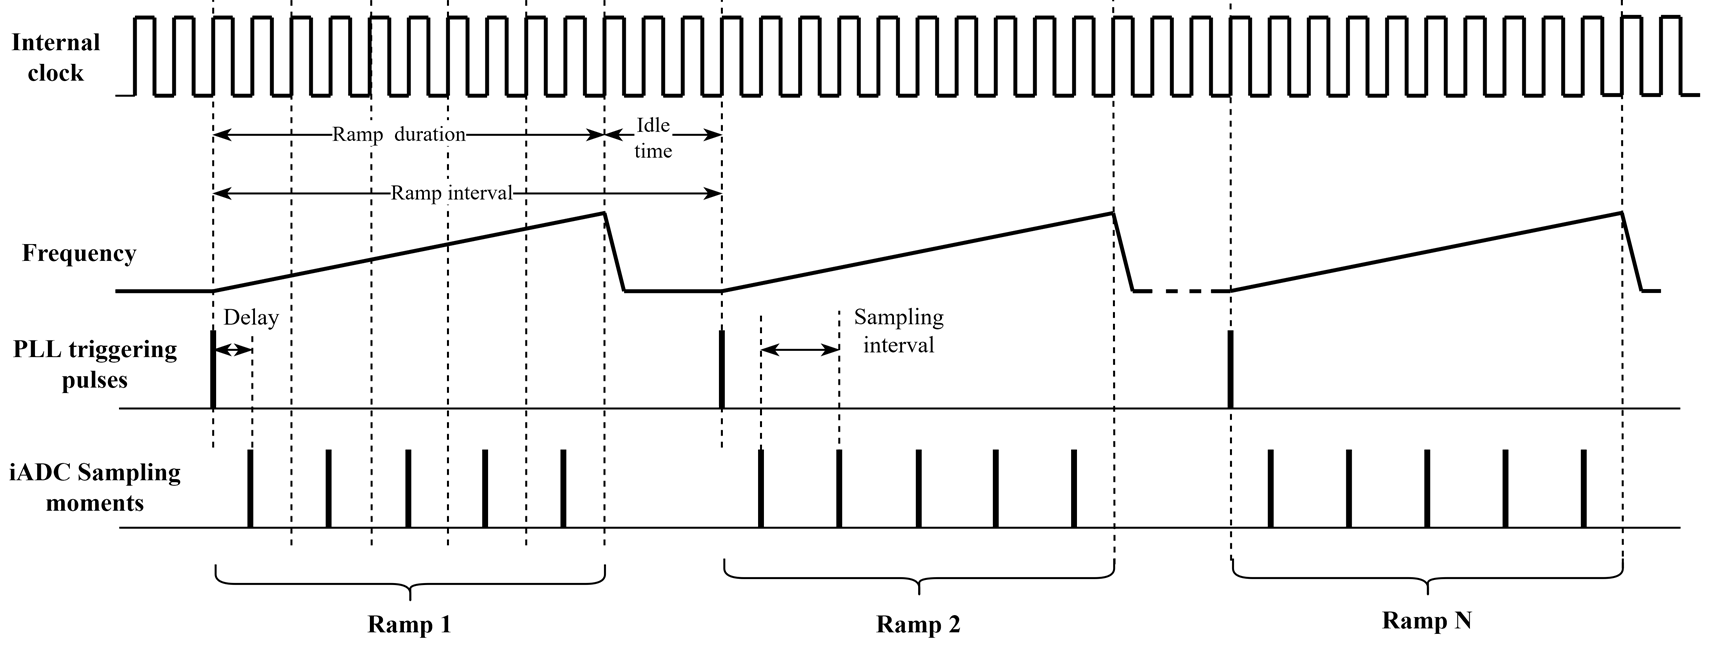
The idle interval is intended to restore PLL frequency to an initial value. At the same time, the housekeeper communicates with the RFE boards and sends commands to switch TX antenna. This takes about 50us. Therefore the idle time should not be setup less than this value.
The triggering is configured by the trg command and has four parameters (further documented in Chapter 3).
The first parameter defines the sampling interval. Its minimum value is si = 4 which gives 4/10MHz = 0.4us sampling interval or 2.5Mhz sampling frequency.
The second parameter is the number of samples per ramp which defines the ramp duration. For example, sc=512 sampling pulses corresponds 512 * 0.4us = 204.8us ramp duration in case of si = 4.
The third parameter ri defines the ramp interval which should be at least 50us greater than the ramp duration. For example, if si = 4 and sc=512, ri maybe chosen equal to 3000 that gives the ramp interval 3000/10MHz = 300us and the idle time about 300us – 204.8us = 95.2us.
And the last parameter rc is the number of ramps in a data cube. Its value should be the power of two and has a minimum value of 32.
For each ADC channel, there is a buffer of 65536 samples length. So it is possible to have various combinations of a number of ramps and sampling pulses per ramp to keep data in the buffer. For example, it is possible to set up 128 ramps x 512 samples, or 64 ramps x 1024 samples, and so on.
2.4 The Baseboard Command Interface
The command interface operates via USB interface. Connection the board to a Windows-based host PC creates a virtual serial port. It supports 115200bps 8-N-1 mode. A terminal program has to be set up to transmit CR+LF at the end of a line.
Recommended command sequence:
1. Set up PGA/baseband gains. 2. Set up triggering parameters. 3. Start trigger. 4. Stop trigger (if triggering with repetition interval).
2.5 Data Interface
Data transmission is performed via Ethernet using UDP. The current implementation uses static IP configuration. By default, the baseboard has IP address 192.168.0.5 and it sends UDP data stream to the address 192.168.0.1, port 5001. Both addresses may be changed via the command interface. But the baseboard keeps setting till reset or power down/up cycle. Therefore in order to receive packets it should be ensured that the destination port has static IP 192.168.0.1 set (via. the adapter options in the Network and Internet settings in windows for example).
The network stack supports ping functionality which may be used for diagnostics.
In case of using the kit with Windows OS, attention should be paid to the firewall settings. For example, native Windows firewall drops incoming UDP packets by default.
The data stream has the following format:
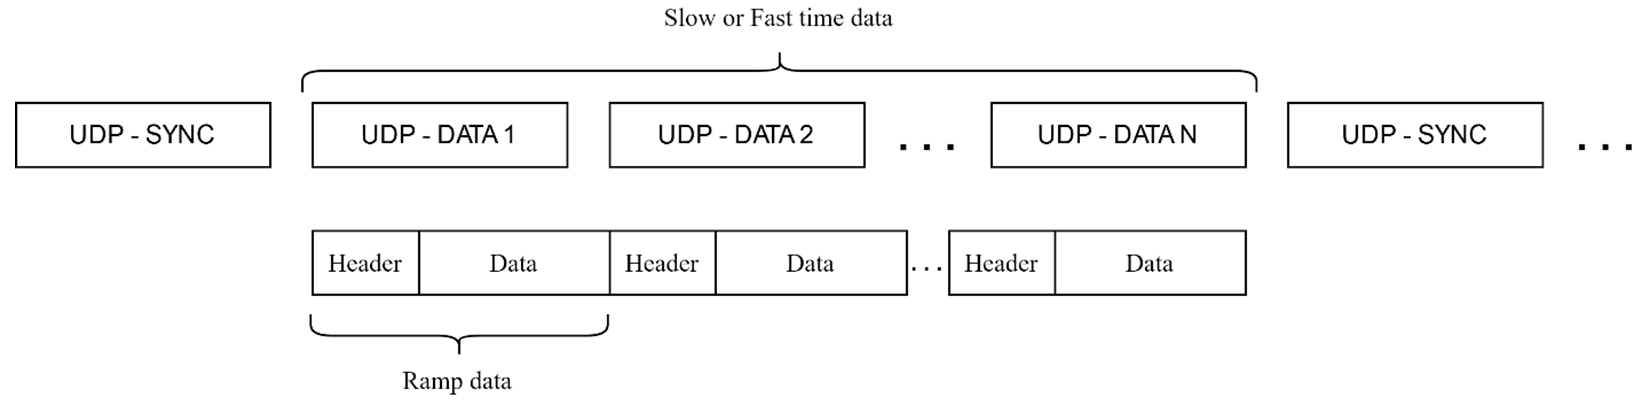
The stream consists of periodic SYNC and DATA packets. The SYNC packets are intended to set up a synchronization among the stream and transmitted by one UDP packet. Data is transmitted by the necessary number of UDP packets.
The data portion consists of ramp data fields. Each of them has a header and a data payload.
The SYNC packet consists of 48 bytes and may be described by the following structure:
typedef struct { uint32_t syncWord_1; uint32_t syncWord_2; uint64_t frameCnt; uint32_t dataLen; uint32_t crc; } SyncFrame_t;
where syncWord_1 = 0x12345678, syncWord_2 = 0xAA55AA55, frameCnt is a counter which is increased every SYNC packet, dataLen is amount of data bytes following SYNC, crc is an optional CRC-32.
The format of the data portion is as in the following figure:
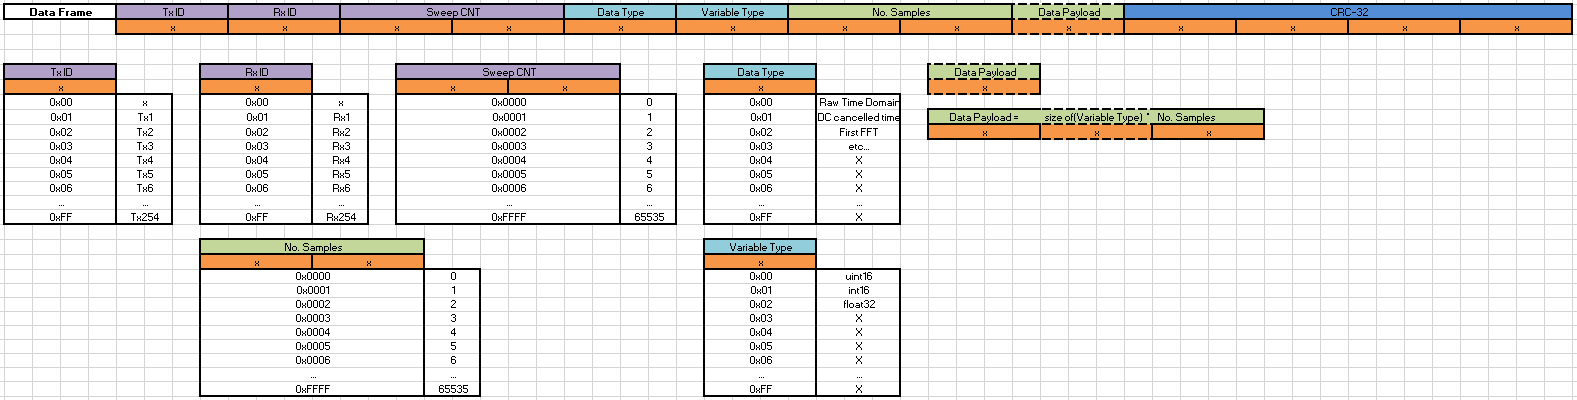
The TxID and RxID field are used to label the transmit and receive channel (thus virtual channel) from which the data in the payload relates to.
The Sweep CNT gives the ramp number of a particular virtual channel. I.e. the first ramp from transmitter Tx1 to receiver Rx1 will have a Sweep CNT of 1, the second will ramp from transmitter Tx1 to receiver Rx1 will have a Sweep CNT of 2, etc..
The Data Type field details the form of the data in the payload. In essence, it defines the preprocessing steps that have taken place on the data. As features are added to the firmware, further options will be added to the Data Type field.
The variable type field gives the format of each sample point in the payload. For example, Raw Time Domain data comes in the form of unsigned 16-bit integer ADC values, whereas FFT points are 32-bit floating-point values.
The No. Samples field gives the number of sample points in the payload.
In order to determine the total size of the Data Payload in bytes, the Variable Type and No. Samples field must be examined together. For example; 512 Raw Time Domain data points will give a data payload of 2 × 512 = 1024 bytes, whereas 512 FFT points will give a data payload of 4 × 512 = 2048 bytes.
When determining the size of the entire data frame, the size of the header and CRC must be factored in also.
2.6 Firmware Update Procedure
The platform has five programmable parts with upgradeable firmware: - Housekeeper MCU - The main controller MCU - Two iADC MCU - RFE board MCU
The listed MCUs are manufactured by ST Microelectronics and should be programmed by STLINK-V3MINI debugger and STM32 ST-LINK Utility.
The firmware is provided in the form of binary files with the following naming: - F446-Housekeeper – housekeeper firmware - H745-MainController_CM7.bin – the main controller firmware - H750-iADC.bin - the iADC firmware (identical for both) - RFE_Controller.bin – RFE controller firmware
The firmware updating is performed using the same steps for each MCU. The only difference is the physical SWD connector used. The baseboard has four SWD connectors and the RFE board has one.
In the figure below an example of ST-LINK cable connection is depicted.
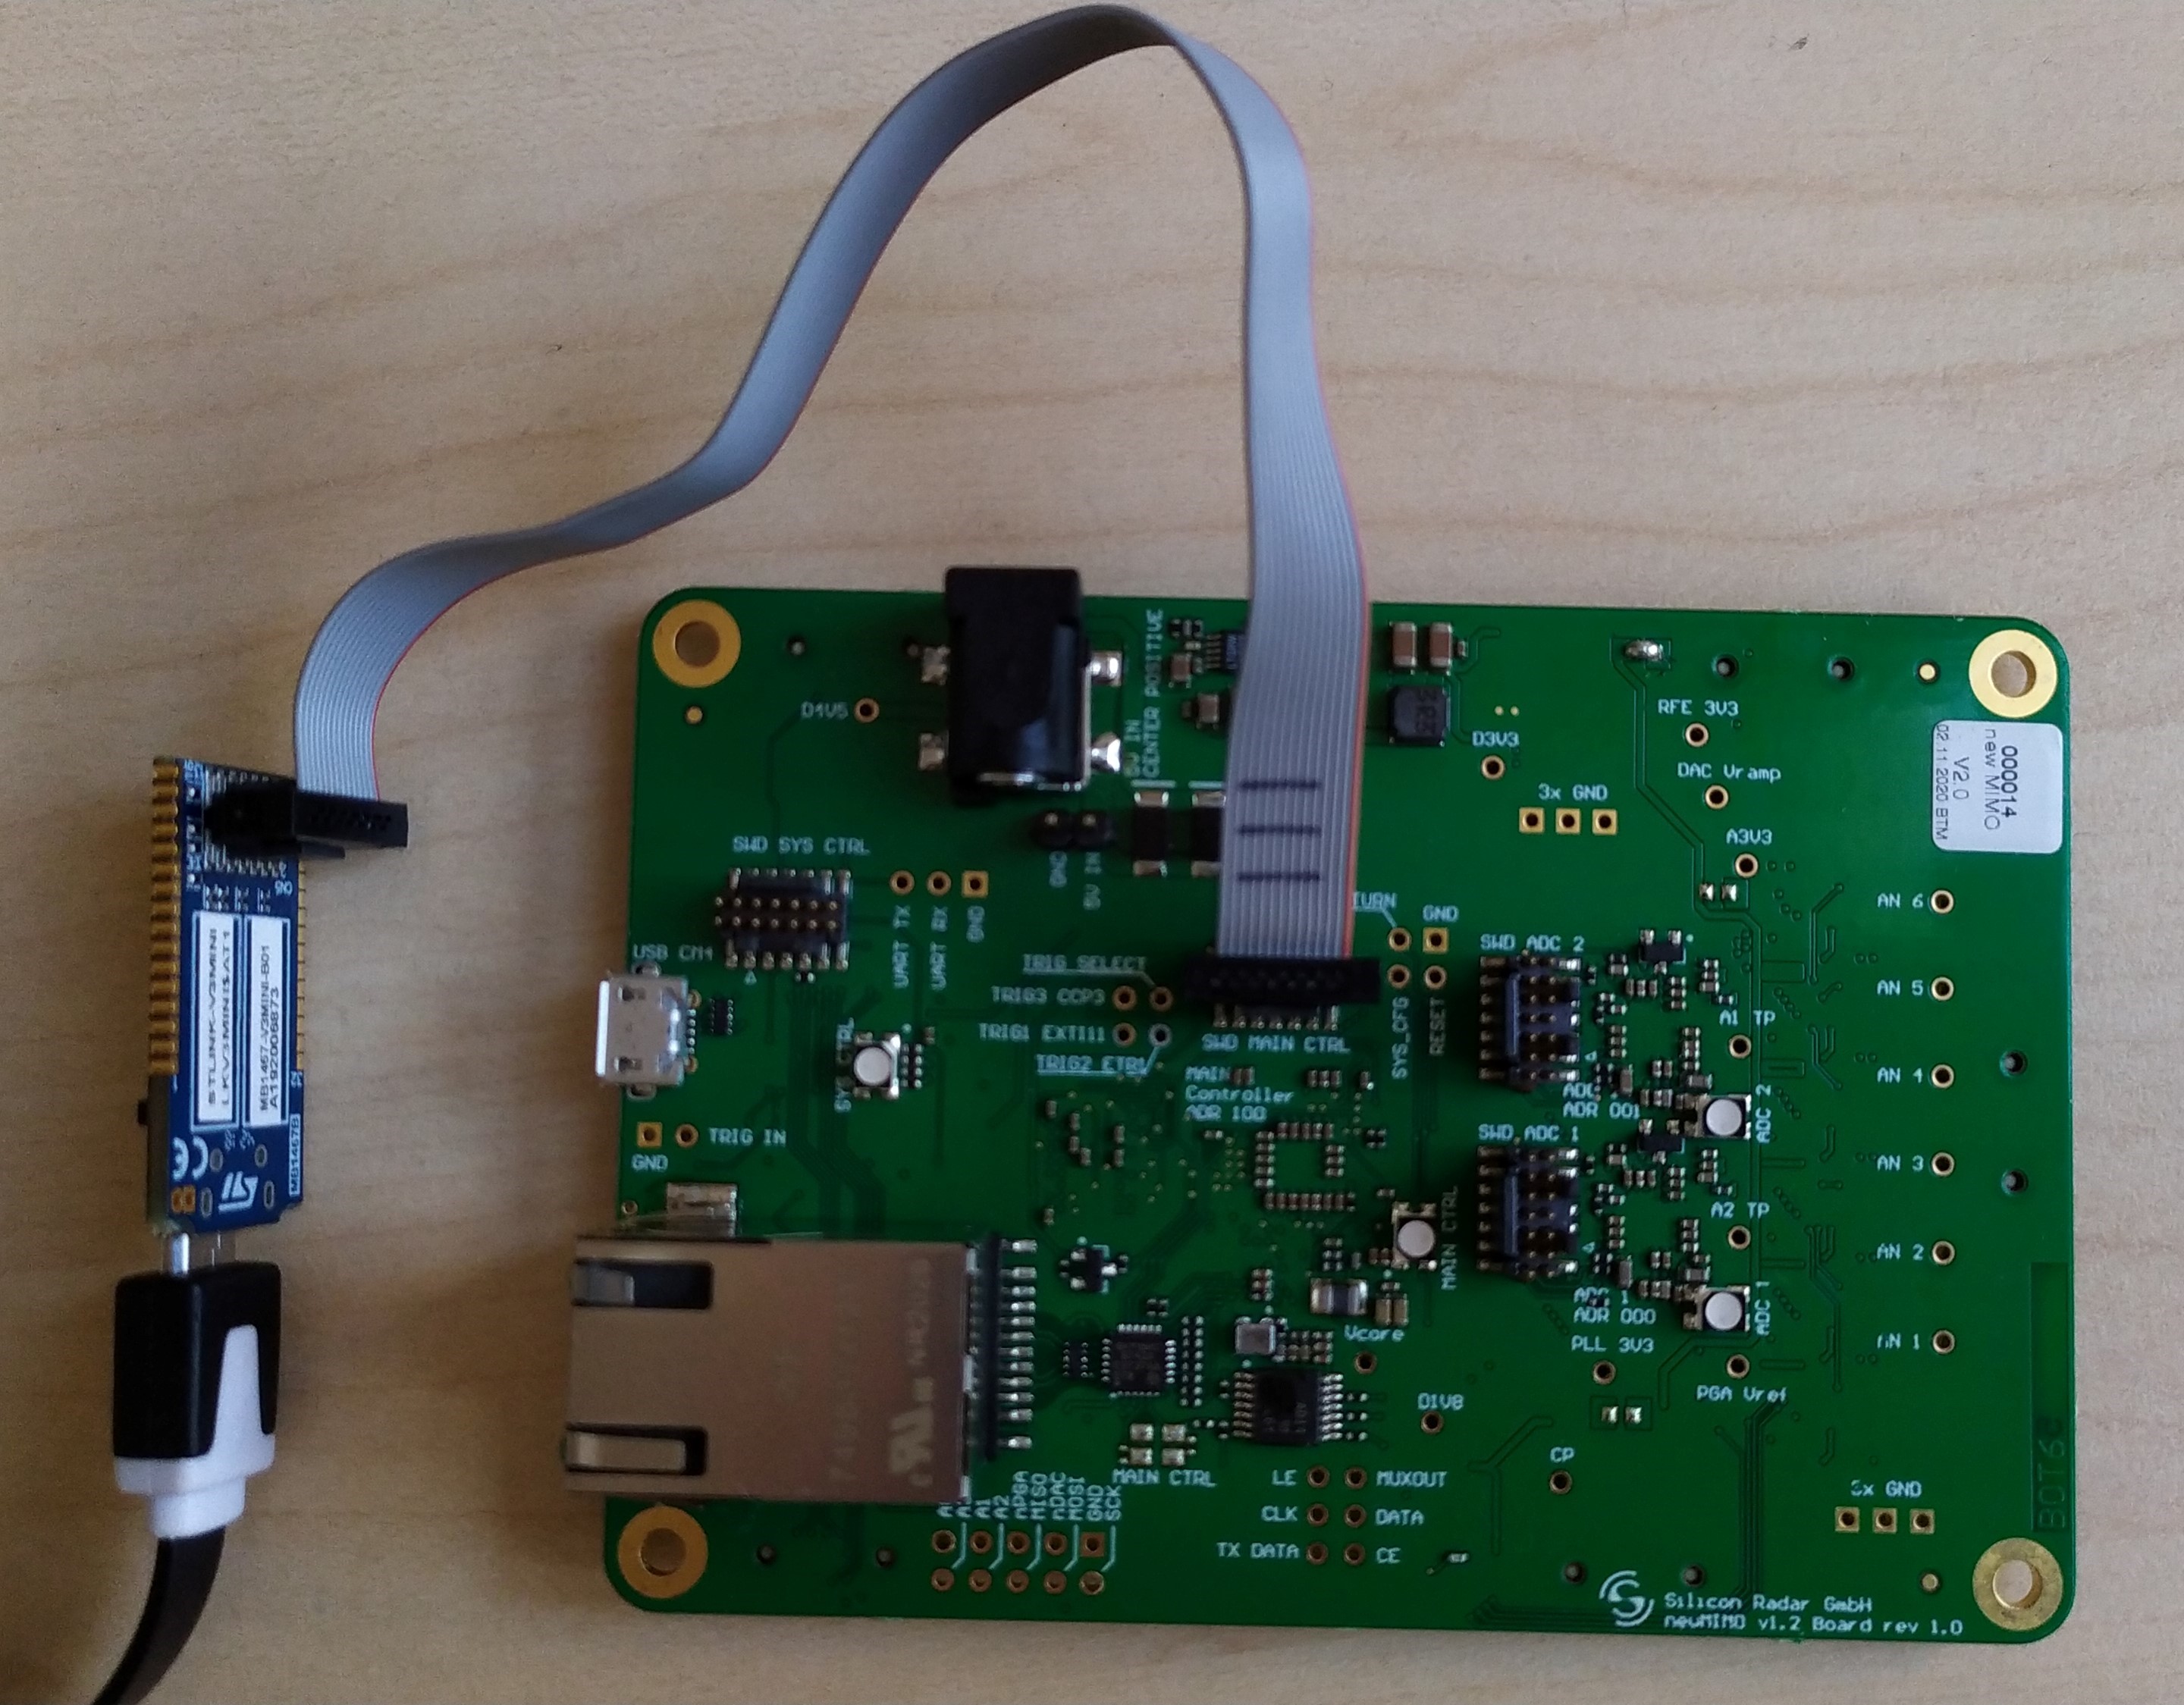
The firmware upgrade is performed by the following steps:
1. Disconnect the power source from the mainboard.
2. Connect STLINK-V3MINI cable to an appropriate SWD connector.
3. Run STM32 ST-LINK Utility.
4. Power up the baseboard
5. In the STM32 ST-LINK Utility select menu Target/Connect.
In case of a successful connection with a target, the program has to report in its status windows. In case of old STLINK-V3MINI internal firmware, ST-LINK Utility may require to update it.
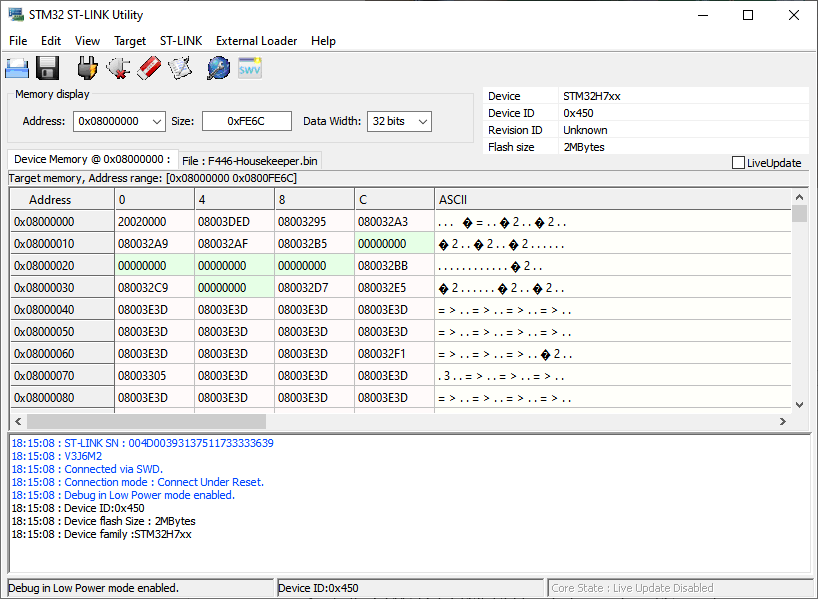
6. Open an appropriate binary file by File/Open file menu.
7. Flash firmware by Target/Program&Verify menu.
8. Disconnect target by Target/Disconnect
9. Disconnected power source from the mainboard.
10. Detach STLINK cable.
3 SiRad MIMO
3.1 SiRad MIMO - 24 GHz
3.1.1 Specifications / Features
Silicon Radar’s MIMO evaluation kit is a fully embedded system providing the user with a number of methods for visualizing and working with MIMO radar data through the use of a GUI. This gives the user the ability to change a number of system parameters and see the resulting system performance.
3.1.2 First Steps
3.1.2.1 Network Configuration:
The Evaluation Kit interfaces with the PC through an Ethernet connection. This connection is managed by a DHCP protocol.
On startup, the kit will search for a DHCP server to become a client of. Once the kit is subscribed to the DHCP server, any client running the GUI will be able to connect to it and run the Kit.
If there is no DHCP server present, the kit will time out searching for the server after approximately 60 seconds and become a DHCP server itself. Once this happens any client connected to the kit (i.e. a user PC) will be assigned an IP address by the kit and will be able to connect to and run the kit via. the GUI.
3.1.2.2 Starting the Kit
Power and Network Connection:
Connect the 5V power block to the kit. Once successfully powered, LED D2 located near the SD card should blink green for a few seconds.
Ensure an Ethernet cable connects the kit to the laptop. Use ipconfig to verify the network settings as described in the previous section.
Using the GUI:
Start the GUI via the executable file provided.
To connect to the Kit, simply click the “connect” button. A green light should appear to signify a successful connection to the kit.
Once a configuration has been chosen via the radar settings panel on the left, use the green “Send configuration” button to configure the kit.
Clicking the red “Start acquisition” button to begin measurements and display. If you to change the configuration, first click the “Stop acquisition” button before choosing new settings, sending the new configuration, and restarting the acquisition.
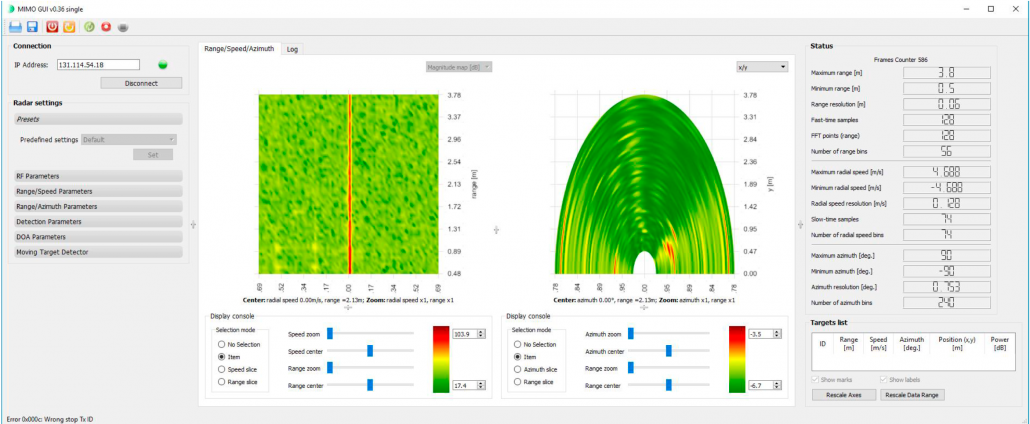
3.1.3 Data Visualization
The two primary data views are Range – Doppler (plotting distance against speed data, shown left in figure above) and Range – Azimuth (plotting range against angular data, shown right in figure above) heat maps. By default they appear as shown in the figure above, but the user has additional options:
- Clicking and dragging anywhere on the heat map will change its perspective and allow the user to view a 3D representation of the heat map.
- Choosing appropriate option in the dialog box below each heat map allows the user to view individual slices along Range, Doppler or Azimuth axis.
The kit processes all displayed information on kit, needing very little resources from a user’s machine, and achieves a minimum update rate of approximately 10Hz.
The GUI also provides a status window giving up-to-date system information to a user based on the current system setup. Vital information including the resolution of range, azimuth and doppler estimation, and other performance statistics are reflected there.
Finally, if target detection is applied, any targets that meet the target detection parameters will appear in the target list. Each target is numbered and displayed with its associated speed, range, and azimuth in a target list, placed in the bottom right of the GUI.
Adjustable System Parameters
Using the GUI the user can have the ability to adjust a great number of system parameters Using the GUI the user can have the ability to adjust a great number of system parameters
- RF Parameters
- Central Frequency between 22GHz - 26GHz,
- Bandwidth selectable from 500MHz - 3GHz
- Pulse Repetition Frequency selectable from 60Hz – 2200Hz
- Adjustable Receiver Gain.
- Range – Doppler Parameters
- Choice of Maximum Range, Minimum Range selectable to limit the field of view.
- Integration Time, Zero Padding and Windowing Function.
- Achievable range resolution of at least 7.5cm.
- Range – Azimuth Parameters
- Maximum Azimuth, Minimum Azimuth selectable to limit the field of view.
- Selectable Azimuth Estimation Algorithm.
- Achievable angular resolution of at least 0.75 degrees.
Signal Processing
The Kit implements a number of signal processing algorithms for user evaluation. In windowing data, the user can select between Rectangular, Hamming and Blackman functions.
The user is also provided with the choice of angular estimation algorithms. Classical Beamforming is implemented as well as more computationally intensive subspace methods of MUSIC and CAPON algorithms to illustrate the relative performance of traditional methods with the improvements possible through greater computational resources.
The option to apply CFAR-based target detection to the heat map data is also implemented on the Kit with selectable CFAR mode, false alarm probability, guard cells, reference cells, and dilation bins. Of the CFAR modes implemented on the kit, the user can select any one of Call Averaging (CA), Smallest of CA, Greatest of CA or Ordered Statistical CFAR. All targets detected according to the user setting get collated to a target list which can be exported separately
3.1.4 Requirements
- MS Windows 7/10
- ST-LINK USB driver (STSW-LINK009)[1]
- Software Package by Silicon Radar
- 5V Barrel Jack Power Supply (5.5mm)
- Ethernet Connection & Cable
3.2 MIMO GUI Software
With the SiRad MIMO, a GUI which provides multiple ways to illustrate data is provided and it can be seen below.
4 SiRad Easy® r4
4.1 Requirements & First Steps
4.1.1 System Requirements
Minimum:
- Microsoft Windows 10 (supported) OR Microsoft Windows 7 (not supported anymore)
- 1 GB free HDD / SSD space
- micro USB to type A cable
- FTDI Chip USB driver (VCP) [2]
Recommended:
- active USB hub with at least 1000mA output current - some radar front ends need more power than provided by USB ports(!)
- 8 GB RAM or more
4.1.2 Software Requirements
Graphical User Interface (WebGUI):
- Java - compatibility matrix [3]
- Mozilla Firefox - compatibility matrix [4]
- Com2WebSocket / WebGUI software by Silicon Radar [5]
For firmware updates over UART / USB:
For firmware updates with an external debugger, without SiRad Easy r4 Breakout Board:
- Debugger: STLINK-V3MINI [8]
- micro USB to type A cable
- ST-LINK USB driver (STSW-LINK009) [9]
- ST-LINK Utility (STSW-LINK004) [10]
For firmware updates with external debugger and SiRad Easy r4 Breakout Board:
- Debugger: STLINK-V3MINI [11] OR STM32 Nucleo-64 development board [12]
- micro USB to type A cable (STLINK-V3MINI) OR mini USB to type A cable (Nucleo-64)
- (Nucleo-64 only) 6pin jumper cable (female-female) OR self-made programming cable
- ST-LINK USB driver (STSW-LINK009) [13]
- ST-LINK Utility (STSW-LINK004) [14]
4.1.3 Recommended Software
4.2 Hardware
- Ecosystem [18]
- Accessories List [19]
- TRA_120_002 SiRad front end datasheet [20]
- TRX_120_001 SiRad front end datasheet [21]
- Schematics [25]
4.2.1 Data Connection via USB Cable (USB Mode)
- Connect a USB cable (micro B to type A), A LED will light up to show that the board is powered and working
- In some cases, the ST-LINK USB Driver may not work, if an additional COM port number cannot be seen in the device manager after the Evaluation Kit has connected, installing a different Virtual COM Port Driver, which is mentioned in the requirements, could be the solution.
Please see Evalkits r4 Software/Firmware section to find detailed information about how to connect EvalKit ( Silicon Radar WebGUI or terminal program). If you want to proceed with Silicon Radar WebGUI, you can consider WebGUI section or if you want to continue with a terminal program you can follow Terminal.
4.2.2 Mounting the Lens (Optional)
Please see lens datasheet [26] for more information.
4.3 Software/Firmware
Sirad Easy r4 has an FMCW firmware, WebGUI, and MATLAB & Octave script in the download area. Please visit Customer Download Area to see the available software/firmware of the SiRad Easy r4 Evaluation kit.
4.3.1 Firmware
If you have any question about how to update and flash firmware please see the below links:
For the detailed information of SiRad Easy r4 FMCW firmware for instance how to configure Raw ADC mode, types of protocol, changing radar parameters, please see this site:
How to tune and speed up the SiRad Evaluation kit, please visit:
How to set the SiRad Evaluation kit into a CW like mode (but with power cycling) with the FMCW firmware:
4.3.2 WebGUI
The SiRad Easy ® Evaluation Kit is developed to demonstrate the functionality of Silicon Radar’s transceiver chips as millimeter-wave distance and velocity sensor front ends.
4.3.3 Terminal Program
You can use a terminal program to send the command strings and log measurement data, for more information :
4.3.4 MATLAB & Octave
A description of how you can set up and import raw ADC data into MATLAB & Octave can be found here:
4.4 FAQ
Not able to find your problem here or your problem not solved by the above suggestions? We strongly suggest you read the FAQs, Protocol Description, and User Guides (in the download area) as they can be the answer to most of your questions.
5 SiRad Easy® and SiRad Simple®
5.1 Requirements
5.1.1 SiRad Easy®
- Microsoft Windows 10
- GUI by Silicon Radar from [27]
- USB cable mini to type A
5.1.2 SiRad Simple®
- Microsoft Windows 10
- GUI by Silicon Radar from [28]
- Serial-FTDI to USB cable or adapter
5.2 Hardware
- Schematics [29]
- TRX_024_007 SiRad front end datasheet [30].
- TRX_024_006 SiRad front end datasheet [31]
- TRA_120_002 SiRad front end datasheet [32]
- TRX_120_001 SiRad front end datasheet [33]
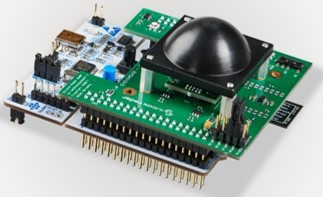
5.2.1 Changing the Radar Front End
The SiRad Easy® Evaluation Kit consists of two radar front ends (24 GHz and 122 GHz), an evaluation baseband board, and an ST Microelectronics Nucleo64 microcontroller board that is stackable. Silicon Radar delivers the Evaluation Kit in the 122 GHz configuration without the lens assembled. Follow the instructions below for changing the Evaluation Kit configuration in SiRad Easy® User Guide.
5.2.2 Data Connection
Please see User Guide SiRad Simple® User Guide and SiRad Easy® User Guide to set up data connection via USB Cable/External Header/Wifi. For more information and additional documents please see Customer Download Area.
- In some cases, the ST-LINK USB Driver may not work, if an additional COM port number cannot be seen in the device manager after the Evaluation Kit has connected, installing a different Virtual COM Port Driver, which is mentioned in the requirements, could be the solution.
- WiFi only: If you are using a WiFi connection to connect to the Evaluation Kit, unfold the ‘COM’ section in the control panel on the left side of the WebGUI. Provide the IP address and the port of the WiFi module of the SiRad Easy® you want to connect to before you proceed, like so: ‘192.168.4.1:9090’. The standard port is 9090. Click the ‘Connect’ button on the top left to connect to the WebSocket provided by the COM2WebSocket tool or to the WiFi module of the Evaluation Kit. The WebGUI should display the sensor data.
Please see Evalkits Software/Firmware section to find detailed information about how to connect EvalKit ( Silicon Radar WebGUI or terminal program). If you want to proceed with Silicon Radar WebGUI, you can consider WebGUI section or if you want to continue with a terminal program you can follow Terminal.
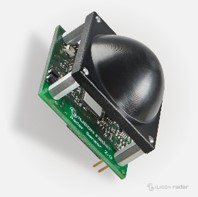
5.2.3 Mounting the Lens (Optional)
Please see lens datasheet [34] for SiRad Easy® and SiRad Simple® for more information.
5.3 Software/Firmware
5.3.1 Firmware
If you have any question about how to update and flash firmware please see the below links:
For detailed information about SiRad EvalKit Output Modes, please see this site:
How to tune and speed up the SiRad Evaluation kit, please visit:
5.3.2 WebGUI
The SiRad Evaluation Kit is developed to demonstrate the functionality of Silicon Radar’s transceiver chips as millimeter-wave distance and velocity sensor front ends.
5.3.3 Terminal Program
You can use a terminal program to send the command strings and log measurement data, for more information :
5.3.4 MATLAB & Octave
Can you help me to set up the device for the use with MATLAB & Octave?
A description of how you can set up and import raw ADC data into MATLAB & Octave can be found here:
5.3.5 C Library
We provide example C source code files for our Evalkit Sirad Easy to help you develop your own application includes project and small example application and driver files for ADC, PLL, radar front end, baseband board, and more, development environment (needed tools): System Workbench (Eclipse) by ST, STM32CubeMX by ST, F3 v1.9.0 MCU package for STM32CubeMX by ST. Please visit our Customer Download Area.
5.4 FAQ
Not able to find your problem here or your problem not solved by above suggestions? We strongly suggest you read the FAQs, Protocol Description, and SiRad Simple® User Guide and SiRad Easy® User Guide as they can be the answer to most of your questions.
6 Eval Boards
For evaluation purposes, Silicon Radar offers Evaluation Boards (or just Eval Boards) suitable for the detailed characterization of our RF MMIC. Such investigations shall support the design-in for Sensor integration and usually are performed within the lab environment applying RF measurement instruments such as spectrum analyzers and vector analyzers. Please note that these Evaluation Boards are stand-alone boards that cannot be used in conjunction with our evaluation kits. For the latter different plug-on radar front end boards are needed.
The overview of available stand-alone - Evaluation Boards is shown in the following Table 1. Please note that Evaluation Boards are manufactured on request. Therefore lead times will apply.
| Board name / for chip | Frequency | Order Nr. | Variants | Picture |
| RX_024_004 | 24 GHz | 000009 | 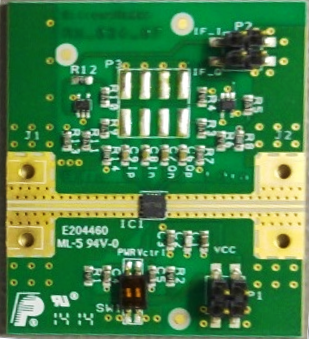
| |
| RX2_024_006 | 24 GHz | 000024 | ||
| TRX_024_006 | 24 GHz | 000007 |
| |
| TRX_024_007 | 24 GHz | 000008 |
| |
| T2R4_024_010 | 24 GHz | 000280 | different RF connectors [*] | 
|
| LNA_024_004 | 24 GHz | 000010 |
[*] depending on the required signal power there is a choice between RF connectors with standard frequency bandwidth and with high-frequency bandwidth.
In case there are further details needed or other evaluation solutions required please contact our Sales and Support Team for further assistance.