Difference between revisions of "SiRad Easy 120 GHz Wideband Front End Board"
(Created page with "__NUMBEREDHEADINGS__ == '''EvalKit Easy – Operation with Front End TRA_120_012x und TRA_120_031 in wide-band modus''' == Since the EvalKit Easy is not recognizing radar fr...") |
(→Return to Operation with automatic recognition of Radar Front Ends) |
||
| (42 intermediate revisions by 4 users not shown) | |||
| Line 1: | Line 1: | ||
__NUMBEREDHEADINGS__ | __NUMBEREDHEADINGS__ | ||
| + | __TOC__ | ||
| + | <!-- | ||
| + | == EvalKit Easy – Operation with Front End TRA_120_012x and TRA_120_031 in wide-band modus == | ||
| + | --> | ||
| − | + | Please flash 120 GHz Wideband Front End firmware to Evalkit before following the steps below. You can download the firmware in our [https://login.siliconradar.com/ Customer Download Area] (you have to register at our site). | |
| − | |||
| − | |||
| − | |||
| − | |||
== Cable Connection == | == Cable Connection == | ||
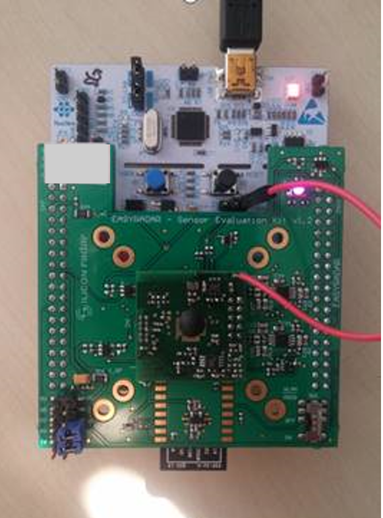
| + | For the power supply to the front end, a separate connection is required. The power cable of the front end can be connected either to the Easy U5V connector as shown in Fig.1, on top of the Nucleo (place in the jumper), or to the bottom of the Nucleo, CN7 pin 18 (+5V, you might need to extend the cable). | ||
| − | + | {| | |
| − | + | |[[File:Fig1_EvalKit_Easy300.png|thumb|200px|Figure 1: EvalKit Easy with 122GHz Front End|link={{filepath:{{PAGENAME:Media:Fig1_EvalKit_Easy300.png}}}}]] | |
| − | [[File:Fig1_EvalKit_Easy300.png| | + | |} |
| − | |||
| − | |||
| − | |||
== Software Start == | == Software Start == | ||
| − | |||
To launch the software evaluation platform please follow this routine: | To launch the software evaluation platform please follow this routine: | ||
| − | + | *connect the WebGUI | |
| − | |||
| − | |||
| − | + | *press the black reset button on the Easy Board (see Figure 1) | |
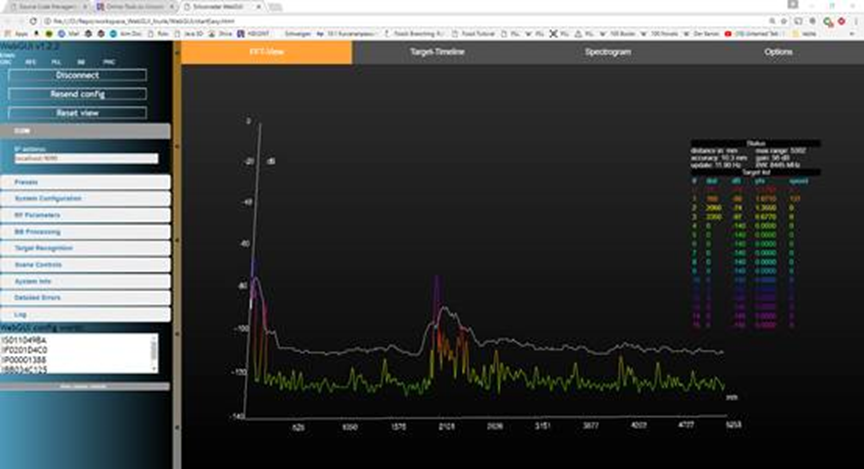
| − | + | In the best case, you already have some useful output if you are pointing the radar head towards a defined target, e.g. the ceiling. In the example shown in Figure 2, this obstacle/object has a distance of around 2m, an additional peak next to the DC peak (left limit of the diagram) can be caused by the operator. This situation describes the measurement result as it should look. | |
| − | + | {| | |
| + | |[[File:Fig2 GUIspecimen.png|thumb|200px|Figure 2: Graph of a radar measurement with one obstacle in 2m distance as it should look like|link={{filepath:{{PAGENAME:Media:Fig2 GUIspecimen.png}}}}]] | ||
| + | |} | ||
| − | But maybe you may end up with a measurement graph rather similar to the one shown in | + | But maybe you may end up with a measurement graph rather similar to the one shown in Figure 3. |
| − | [[File:Fig3_GUI_false_chart.png| | + | {| |
| − | + | |[[File:Fig3_GUI_false_chart.png|thumb|200px|Figure 3: Resulting graph of a radar measurement, if operating conditions are not properly chosen|link={{filepath:{{PAGENAME:Media:Fig3_GUI_false_chart.png}}}}]] | |
| − | + | |} | |
| − | In such | + | In such cases, the radar board operation and parameter setting need to be reviewed as described in Section 4. |
== Parameter Setting == | == Parameter Setting == | ||
| − | |||
Whatever measurement graph you receive, please continue with the following steps: | Whatever measurement graph you receive, please continue with the following steps: | ||
| − | - | + | - RF Parameters tab <!-- (cf. Fig. 17 in the user guide) //commented this because user guide does not contain a figure 17.--> |
| + | o Insert a Bandwidth (MHz) of 10'000 MHz as start value and change later to the maximum operation bandwidth used | ||
| + | o Set the Base frequency (MHz) to 122'000 MHz. | ||
| − | - | + | - BB Processing tab |
| − | + | o Adjust ADC clock divider to around 1-2ms or more (please watch the DC peaks) | |
| − | + | o Adjust the Number of samples to 1024 or more | |
| − | + | o Adjust FFT size to 1024 | |
| − | |||
| − | |||
| − | |||
| − | |||
| − | |||
| − | |||
| − | |||
| − | |||
| − | |||
| − | |||
| − | |||
| − | |||
| − | |||
| − | |||
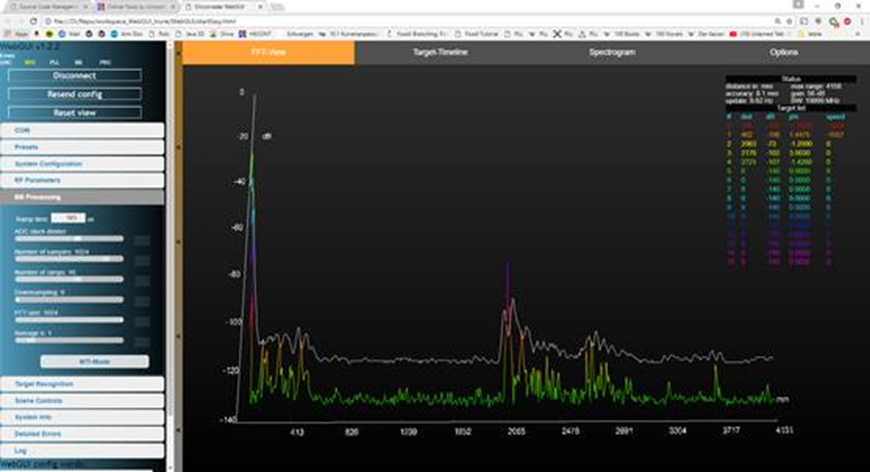
| − | + | After you have performed all steps you should get an output similar to the one in Figure 4. | |
| − | + | {| | |
| + | |[[File:Fig4_GUI_corrected_parameter.png|thumb|200px|Figure 4: Radar Measurement following the parameter setting, still targeting an object at a distance of 2 meters|link={{filepath:{{PAGENAME:Media:Fig4_GUI_corrected_parameter.png}}}}]] | ||
| + | |} | ||
Latest revision as of 06:36, 16 June 2021
Please flash 120 GHz Wideband Front End firmware to Evalkit before following the steps below. You can download the firmware in our Customer Download Area (you have to register at our site).
1 Cable Connection
For the power supply to the front end, a separate connection is required. The power cable of the front end can be connected either to the Easy U5V connector as shown in Fig.1, on top of the Nucleo (place in the jumper), or to the bottom of the Nucleo, CN7 pin 18 (+5V, you might need to extend the cable).
2 Software Start
To launch the software evaluation platform please follow this routine:
- connect the WebGUI
- press the black reset button on the Easy Board (see Figure 1)
In the best case, you already have some useful output if you are pointing the radar head towards a defined target, e.g. the ceiling. In the example shown in Figure 2, this obstacle/object has a distance of around 2m, an additional peak next to the DC peak (left limit of the diagram) can be caused by the operator. This situation describes the measurement result as it should look.
But maybe you may end up with a measurement graph rather similar to the one shown in Figure 3.
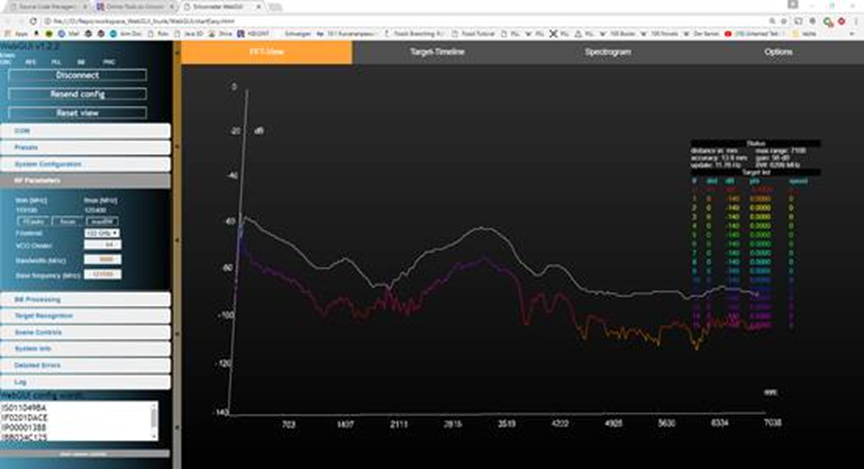
In such cases, the radar board operation and parameter setting need to be reviewed as described in Section 4.
3 Parameter Setting
Whatever measurement graph you receive, please continue with the following steps:
- RF Parameters tab
 o	Insert a Bandwidth (MHz) of 10'000 MHz as start value and change later to the maximum operation bandwidth used
 o	Set the Base frequency (MHz) to 122'000 MHz.
- BB Processing tab
 o	Adjust ADC clock divider to around 1-2ms or more (please watch the DC peaks)
 o	Adjust the Number of samples to 1024 or more
 o	Adjust FFT size to 1024
After you have performed all steps you should get an output similar to the one in Figure 4.