Evalkits
Contents
- 1 Single Channel
- 2 Multi Channel
- 3 Hardware
- 4 Software
- 5 Design your Sensor
- 6 FAQ
| Kit name | Frequency | Order Nr. | Variants | Picture |
| SiRad Easy® | 24/60/120/300 GHz | 24/120 GHz 120 GHz wideband 300 GHz |
||
| SiRad Simple® | 120 GHz | |||
| SiRad MIMO | 24 GHz |
1 Single Channel
1.1 SiRad Easy® - 24 / 60 / 120 / 300 GHz
1.1.1 Specifications / Features
This section is under construction. We will come back with more information soon. Thank you for your patience.
Silicon Radar Support Team
1.1.2 Requirements
- MS Windows 7/10
- 32 bit Java JRE/JDK 1.8.0-111
- Google Chrome or Mozilla Firefox
- ST-LINK USB driver (STSW-LINK009)[1]
- Software Package by Silicon Radar
- USB cable mini to type A
1.1.3 First Steps
Thank you for purchasing our evaluation kit. You can find a comprehensive guide under SiRad Easy and First Steps including, for example, the complete user guide, how to change the front ends, hardware configuration, sample configurations, how to acquire data to the PC, how to trouble shoot the device and more.
1.1.4 120 GHz Wideband & 300 GHz Front Ends
1.2 Overview and Package Contents
Thank you for purchasing Silicon Radar’s SiRad Easy® Evaluation Kit. SiRad Easy® is an easy to use, state-of-the-art radar sensor evaluation system including a high performance target recognition algorithm and WiFi connectivity.
What’s in the box?
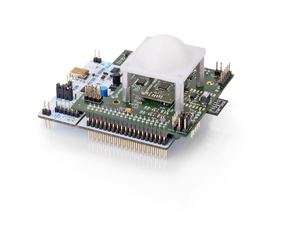
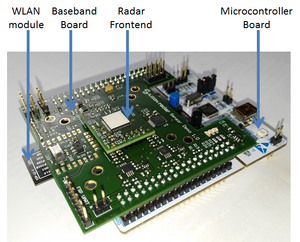
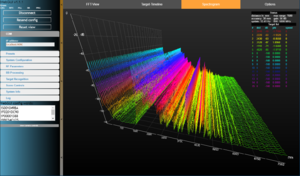
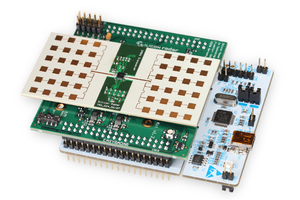
The SiRad Easy® Evaluation Kit consists of two radar front ends (24 GHz and 122 GHz), an evaluation baseband board, and an ST Microelectronics Nucleo64 microcontroller board – all stackable as shown in Figure 1 (left). The SiRad Easy® Evaluation Kit comes with a free graphical user interface for user-friendly parametrization of the baseband board and multiple visualization modes for radar data, shown in Figure 1
The SiRad Easy® Evaluation Kit demonstrates the performance and parameters of the 122 GHz radar transceiver chip of Silicon Radar. The aim of the evaluation kit is to showcase the FMCW / CW radar mode using a beginner-friendly system. Due to the flexibility of the system, it can be used to change important radar parameters on-the-fly to learn the basics of radar signal processing or to find specific parameter settings for a certain radar sensor application.
Silicon Radar puts the focus of the SiRad Easy® Evaluation Kit on an easy-to-use approach and supports the customer with a set of default key parameters guaranteeing a proper operation of the radar hardware (including automatically set parameters of optimized operation mode).
1.2.1 Overview
The SiRad Easy® Evaluation Kit is an experimental showcase system for Silicon Radar’s different integrated IQ transceivers with antennas in package and on board. For more information about the features of Silicon Radar’s transceiver chips, all data sheets are available on the Silicon Radar webpage .
We developed the evaluation kit to demonstrate our millimeter-wave sensors to measure the distance and velocity using RADAR principles. Both - frequency modulated continuous wave (FMCW) or continuous wave (CW) - principles are applied.
1.2.2 Features
The SiRad Easy® Evaluation Kit feature set includes:
- phase locked loop (PLL) running the integrated low phase noise Push-Push VCO in the transceiver chip,
- frequency lock control to automatically adjust the start and stop frequencies of the generated FMCW radar frequency ramp,
- programmable FMCW parameters,
- support for 122 GHz ISM band or ~7 GHz high bandwidth FMCW operations for TRX_120_0xx chips,
- support for 24 GHz ISM band or ~3 GHz high bandwidth operations for TRX_24_0xx chips,
- analog signal conditioning to amplify and filter the I and Q output signals of the transceiver,
- Analog-to-Digital-converter to digitize the I and Q receiver signals,
- microcontroller to do :
- PLL setup, ramp configuration, A-D conversion,
- signal processing and target recognition for up to 16 targets simultaneously,
- transfer to the host system, trigger configurable GP output pins,
- web-based graphical user interface to change relevant parameters, plot the FFT of the baseband channels, display the distance and velocity measurements and the target list,
- standard USB or WiFi communication to PC,
- DC-DC conversion to provide single supply from USB or an external DC supply.
1.2.3 Application
The SiRad Easy® Evaluation Kit is supposed to be used for short-term evaluation purposes in laboratory environments only. All regulations of the according Silicon Radar Evaluation Agreement may apply.
IMPORTANT:
The radar front ends are able to use a larger bandwidth than what is allowed in the ISM bands. In most countries, the bandwidth is limited to 1 GHz between 122 GHz and 123 GHz for production purposes by law. Please check your local regulations. It remains the customer’s responsibility to assure the operation of the front end according to local regulations, especially applying to frequency band allocations outside of the laboratory environment. Silicon Radar and its distributors will not accept any responsibility for consequences resulting from the disregard of these instructions and warnings. Please also refer to Section 7 of this document.
1.3 SiRad Simple® - 120 GHz fixed
1.3.1 Specifications / Features
This section is under construction. We will come back with more information soon. Thank you for your patience.
Silicon Radar Support Team
1.3.2 Requirements
- MS Windows 7/10
- 32 bit Java JRE/JDK 1.8.0-111
- Google Chrome or Mozilla Firefox
- FTDI-USB driver, if not provided by Windows
- Software Package by Silicon Radar
- Serial FTDI-USB cable to USB type A
1.3.3 First Steps
Thank you for purchasing our evaluation kit. You can find a comprehensive guide under SiRad Simple and First Steps including, for example, the complete user guide, how to change the front ends, hardware configuration, sample configurations, how to acquire data to the PC, how to trouble shoot the device and more.
1.4 Overview and Package Contents
Thank you for purchasing Silicon Radar’s SiRad Simple® Evaluation Kit. SiRad Simple® is an easy to use, state-of-the-art 122 GHz radar sensor including a high performance target recognition algorithm and WiFi connectivity.
What’s in the box?
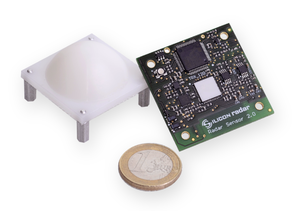
The SiRad Simple® Evaluation Kit consists of one 122 GHz sensor board and one lens assembly as shown in Figure 1 (left). The SiRad Simple® Evaluation Kit comes with a free graphical user interface for user-friendly parametrization of the sensor and multiple visualization modes for radar data, shown in Figure 1
The SiRad Simple® Evaluation Kit demonstrates the performance and parameters of the 122 GHz radar transceiver chip of Silicon Radar. The aim of the evaluation kit is to showcase the FMCW / CW radar mode using a beginner-friendly system. Due to the flexibility of the system, it can be used to change important radar parameters on-the-fly to learn the basics of radar signal processing or to find specific parameter settings for a certain radar sensor application.
Silicon Radar puts the focus of the SiRad Simple® Evaluation Kit on an easy-to-use approach and supports the customer with a set of default key parameters guaranteeing a proper operation of the sensor (including automatically set parameters of optimized operation mode).
1.4.1 Overview
The SiRad Simple® Evaluation Kit is an experimental showcase system for Silicon Radar’s highly integrated 122 GHz IQ transceiver with antennas in package. For more information about the features of Silicon Radar’s transceiver chips, all data sheets are available on the Silicon Radar webpage .
We developed the evaluation kit to demonstrate our millimeter-wave sensors to measure the distance and velocity using RADAR principles. Both, frequency modulated continuous wave (FMCW) or continuous wave (CW), principles are applied.
1.4.2 Features
The SiRad Simple® Evaluation Kit feature set includes:
- phase locked loop (PLL) running the integrated low phase noise Push-Push VCO in the transceiver chip,
- frequency lock control to automatically adjust the start and stop frequencies of the generated FMCW radar frequency ramp,
- programmable FMCW parameters,
- 122 GHz ISM band or ~7 GHz high bandwidth FMCW operations,
- analog signal conditioning to amplify and filter the I and Q output signals of the transceiver,
- Analog-to-Digital-converter to digitize the I and Q receiver signals,
- microcontroller to do
- PLL setup, ramp configuration, A-D conversion,
- signal processing and target recognition for up to 16 targets simultaneously,
- transfer to the host system, trigger configurable GP output pins,
- web-based graphical user interface to change relevant parameters, plot the FFT of the baseband channels, display the distance and velocity measurements and the target list,
- standard USB or WiFi communication to PC,
- DC-DC conversion to provide single supply from USB or an external DC supply.
1.4.3 Application
The SiRad Simple® Evaluation Kit is supposed to be used for short-term evaluation purposes in laboratory environments only. All regulations of the according Silicon Radar Evaluation Agreement may apply.
IMPORTANT: The radar front ends are able to use a larger bandwidth than what is allowed in the ISM bands. In most countries, the bandwidth is limited to 1 GHz between 122 GHz and 123 GHz for production purposes by law. Please check your local regulations. It remains the customer’s responsibility to assure the operation of the front end according to local regulations, especially applying to frequency band allocations outside of the laboratory environment. Silicon Radar and its distributors will not accept any responsibility for consequences resulting from the disregard of these instructions and warnings. Please also refer to Section 7 of this document.
2 Multi Channel
2.1 SiRad MIMO - 24 GHz
2.1.1 Specifications / Features
Silicon Radar’s MIMO evaluation kit is a fully embedded system providing the user with a number of methods for visualizing and working with MIMO radar data through the use of a GUI. This gives the user an ability to change a number of system parameters and see the resulting system performance.
2.1.1.1 Data Visualization
The two primary data views are Range – Doppler (plotting distance against speed data, shown left in figure above) and Range – Azimuth (plotting range against angular data, shown right in figure above) heat maps. By default they appear as shown in the figure above, but the user has additional options:
- Clicking and dragging anywhere on the heat map will change its perspective and allow the user view a 3D representation of the heat map.
- Choosing appropriate option in the dialog box below each heat map allows the user to view individual slices along Range, Doppler or Azimuth axis.
The kit processes all displayed information on kit, needing very little resources from a user’s machine and achieves a minimum update rate of approximately 10Hz.
The GUI also provides a status window giving up-to-date system information to a user based on the current system setup. Vital information including the resolution of range, azimuth and doppler estimation and other performance statistics are reflected there.
Finally if target detection is applied, any targets that meet the target detection parameters will appear in the target list. Each target is numbered and displayed with its associated speed, range and azimuth in a target list, placed in the bottom right of the GUI.
2.1.1.2 Adjustable System Parameters
Using the GUI the user can has the ability to adjust a great number of system parameters Using the GUI the user can has the ability to adjust a great number of system parameters
- RF Parameters
- Central Frequency between 22GHz - 26GHz,
- Bandwidth selectable from 500MHz - 4GHz
- Pulse Repetition Frequency selectable from 60Hz – 2200Hz
- Adjustable Receiver Gain.
- Range – Doppler Parameters
- Choice of Maximum Range, Minimum Range selectable to limit the field of view.
- Integration Time, Zero Padding and Windowing Function.
- Achievable range resolution of at least 7.5cm.
- Range – Azimuth Parameters
- Maximum Azimuth, Minimum Azimuth selectable to limit the field of view.
- Selectable Azimuth Estimation Algorithm.
- Achievable angular resolution of at least 0.75 degrees.
2.1.1.3 Signal Processing
The Kit implements a number of signal processing algorithms for user evaluation. In windowing data the user can select between Rectangular, Hamming and Blackman functions.
The user is also provided with the choice angular estimation algorithms. Classical Beamforming is implemented as well as more computationally intensive subspace methods of MUSIC and CAPON algorithms to illustrate the relative performance of traditional methods with the improvements possible through greater computational resources.
The option to apply CFAR-based target detection to the heat map data is also implemented on the Kit with selectable CFAR mode, false alarm probability, guard cells, reference cells and dilation bins. Of the CFAR modes implemented on the kit, the user can select any one of Call Averaging (CA), Smallest of CA, Greatest of CA or Ordered Statistical CFAR. All targets detected according to the user setting get collated to a target list which can be exported separately
2.1.2 Requirements
- MS Windows 7/10
- ST-LINK USB driver (STSW-LINK009)[2]
- Software Package by Silicon Radar
- 5V Barrel Jack Power Supply (5.5mm)
- Ethernet Connection & Cable
2.1.3 First Steps
This section is under construction. We will come back with more information soon. Thank you for your patience.
Silicon Radar Support Team
2.2 SiRad MIMO - 60 GHz (upcoming)
2.2.1 Specifications / Features
This section is under construction. We will come back with more information soon. Thank you for your patience.
Silicon Radar Support Team
2.2.2 Requirements
This section is under construction. We will come back with more information soon. Thank you for your patience.
Silicon Radar Support Team
2.2.3 First Steps
This section is under construction. We will come back with more information soon. Thank you for your patience.
Silicon Radar Support Team
3 Hardware
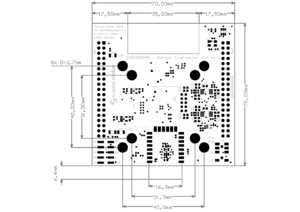
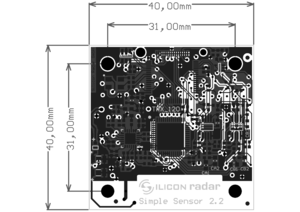
3.1 Mechanical Drawing
SiRad Easy®
SiRad Simple®
3.2 Front Ends
This section is under construction. We will come back with more information soon. Thank you for your patience.
Silicon Radar Support Team
3.3 Interfaces
This section is under construction. We will come back with more information soon. Thank you for your patience.
Silicon Radar Support Team
3.4 Hardware Setup
3.4.1 Changing the Radar Front End
The SiRad Easy® Evaluation Kit consists of two radar front ends (24 GHz and 122 GHz), an evaluation baseband board, and an ST Microelectronics Nucleo64 microcontroller board that are stackable. Figure 2 and Figure 3 show the 24 GHz and the 122 GHz configurations. Silicon Radar delivers the Evaluation Kit in the 122 GHz configuration without the lens assembled. Follow the instructions below for changing the Evaluation Kit configuration.
Disassembly
- Disconnect the USB cable from the Evaluation Kit.
- Remove the radar front end from the baseband board. Grab the short edges and pull it straight out of its connections. Do not tilt or bend the front end.
- Not recommended unless the baseband board or the microcontroller board must be replaced: Remove the baseband board from the microcontroller board by grabbing the short edges and pulling it straight out of its connections. Do not tilt or bend the baseband board.
Assembly
- If you need to connect the baseband board to the microcontroller board, first look for any bend connectors. Pull them straight before trying to connect the boards. Connect the baseband board to the microcontroller board by placing them on top of each other and matching the connectors. The WiFi module should point away from the USB connector of the microcontroller board. Now slightly press them together alternately on both sides until both boards are fully connected. Improper connection may cause shortcuts and destroy the boards
- The radar front end has to be attached to the baseband board from the top side (where the LEDs are located). It can only be connected in one way since the headers are different. Improper connection may cause shortcuts and destroy the boards.
3.4.2 Understanding the External Header (J1)
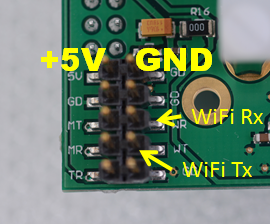
The external header in Figure 2 is used to connect to the sensor board in different operating modes. In WiFi mode, the external header is used to connect the WiFi module to the microcontroller on the board. The wireless data connection setup via WiFi is explained in Section 2.1.4. In programming mode, the external header is used to program either the WiFi module or the microcontroller, please see Section 5. The external header can also be used to trigger measurements manually via the external trigger line (TR), also see Section 3.2.3.1.
3.4.3 Data Connection via USB Cable (USB Mode)
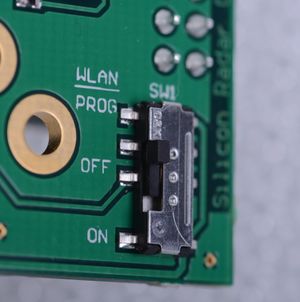
Put the jumper JP5 on the microcontroller board in the U5V setting like shown in Figure 5 (left). Remove all jumpers from the external header on the baseband board shown in Figure 5 (middle). Bring the WiFi switch SW1 on the baseband board in the OFF position as shown in Figure 5 (right). The Evaluation Kit can now be connected to a PC using a USB cable. We recommend using an active USB Hub between the PC and the Evaluation Kit, especially when connected to a Laptop. Alternatively, the board can be powered by a standard 5V supply via the external header (pins 5V and any of the four GD pins). Please proceed to Section 2.1.5 to install the lens (optional) or to Section 2.2 for running the Evaluation Kit software.
3.4.4 Wireless Data Connection via WiFi (WiFi Mode)
Put the jumper JP5 on the microcontroller board in the E5V setting like shown in Figure 6 (left). Use the jumpers delivered with the Evaluation Kit and connect MT/WR and MR/WT on the baseband board as shown in Figure 6 (middle). Apply power from a standard source: +5V to the 5V pin and GND to the any GD pin (there are four) of the external header (J1). Bring the WiFi switch SW1 on the baseband board in the ON position as shown in Figure 6 (right). Please proceed to Section 2.1.5 to install the lens (optional) or to Section 2.2 for running the Evaluation Kit software
3.4.5 Mounting the Lens (Optional)
The maximum range of the 122 GHz front end is approximately 40 meters with an opening angle of around +/- 30 degrees (-6dB) for strong targets like a building or car. With the lens mounted, the opening angle decreases to around +/- 4 degrees. Figure 7 shows a schematic diagram of the two configurations modes - with and without the lens. The range will only increase slightly when mounting the lens. Please install the lens at a distance about 10 to 15 mm away from the radar front end’s surface, see Figure 8. You can use the provided 10 mm spacers to mount the lens. The lens has a focal length of 15 mm with an opening angle of +/- 4 degrees. If it is installed closer to the radar front end, the beam will be wider
4 Software
4.1 Overview & Workflow
4.1.1 SiRad EvalKit
This section describes the measurement flow of the SiRad Evaluation Kit with its parameters. The measurement parameters as well as the kind and amount of transmitted data can be adapted using the SiRad Evaluation Kit communication protocol described in the following sections.
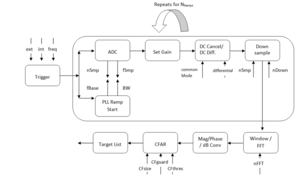
The signal flow of the radar measurement is shown in Figure 1. Each measurement cycle is initiated by either an internal ‘Self-Trigger’ (int) or an external ‘Manual Trigger’ (ext). Continuous measurements can be triggered with a certain trigger frequency (freq).
Once a trigger is received, the PLL is started that drives a frequency ramp from fBase to (fBase + BW) with the currently set base-frequency (fBase) and the currently set bandwidth (BW). The radar frontend starts its detection in the chosen frequency range.
The AD converter (ADC) begins processing the chosen number of data samples (nSmp) with a certain sample frequency (fSmp). The received data is amplified either by a manually set gain value (once) or by a continuously recalculated automatically acquired gain value (cont.), further named Auto Gain Control (AGC) Mode. If set, a DC cancellation is done.
The current measurement is repeated n times (for a number of nRamps frequency ramps) and the previous ramp is processed while a new ramp is generating. Therefore, depending on the processing settings, there can be a small delay between each ramp in one set. When downsampling is active (with a certain downsampling number nDown), each nDown ramps are summed and the rest is zero-padded.
The downsampled data is processed by a window function and then transformed by an FFT with nFFT points. The magnitude, phase and other information is extracted from the FFT output for the target list. The targets are detected by the CFAR operator with its parameters CFsize, CFguard and CFthres that is applied to the FFT output. A target list is then created from the CFAR output and the data extracted from the FFT output.
All data is always transferred immediately after a measurement took place.
4.2 Software Installation
4.2.1 Software Requirements
SiRad Easy®
The SiRad Easy® Evaluation Kit software for PC is available at the Silicon Radar webpage upon request. There are two options to connect the SiRad Easy® to the Evaluation Kit software, either using the USB connection provided by a virtual COM port – explained in Section 2.2.2 – or via WiFi – explained in Section 2.2.3. The hardware setup for the USB and WiFi connection modes have been explained in Section 2.1.3 (USB) and 2.1.4 (WiFi).
Please configure the SiRad Easy® for either the USB mode or the WiFi mode before proceeding to one of the next sections.
The Evaluation Kit software requires a web browser (not included in the software package) that supports WebGL, for example, Google Chrome Browser or Mozilla Firefox. WebGL requires a graphics card that supports OpenGL. Further, the software requires a 32 bit Java JRE or JDK version 8 update 111 or later to be installed on the system running the software. Please also see Table 1 for the software requirements.
Please note that 64 bit Java is not supported by the software package.
| Requirement | Software / Version |
|---|---|
| Operating system | Microsoft Windows 7/10 |
| Java | 32 bit Java JRE / JDK 8u111 or higher |
| Browser | Chrome Browser or Mozilla Firefox |
SiRad Simple®
The SiRad Simple® Evaluation Kit software for PC is available at the Silicon Radar webpage upon request. There are two options to connect the sensor to the Evaluation Kit software, either using a UART-USB connection provided by a virtual COM port – explained in Section 2.2.2 – or via WiFi – explained in Section 2.2.3. The hardware setup for the UART and WiFi connection modes have been explained in Section 2.1.2 (UART) and 2.1.3 (WiFi).
Please configure the sensor board for either the UART mode (for the USB connection) or the WiFi mode before proceeding to one of the next sections.
The Evaluation Kit software requires a web browser (not included in the software package) that supports WebGL, for example, Google Chrome Browser or Mozilla Firefox. WebGL requires a graphics card that supports OpenGL. Further, the software requires a 32 bit Java JRE or JDK version 8 update 111 or later to be installed on the system running the software. Please also see Table 1 for the software requirements.
Please note that 64 bit Java is not supported by the software package.
| Requirement | Software / Version |
|---|---|
| Operating system | Microsoft Windows 7/10 |
| Java | 32 bit Java JRE / JDK 8u111 or higher |
| Browser | Chrome Browser or Mozilla Firefox |
4.2.2 Connecting to the Board via USB
SiRad Easy®
Installing the USB driver and Flash Tool To install the USB driver, go to the ST Microelectronics website and download and install ST-LINK USB driver (STSW-LINK009). Once the USB driver is installed, the Evaluation Kit should provide a virtual COM port.
Installing the Evaluation Kit’s COM2WebSocket tool
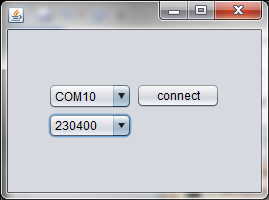
The Evaluation Kit software contains a COM2WebSocket tool that creates a WebSocket from the virtual COM port to provide it to the graphical user interface. You can find the tool in the Install Package in the ‘Software’ folder. The COM2WebSocket tool is portable and can be copied to a path of your choice on your PC. Make sure that the java.exe of your Java JRE or SDK installation is available in the PATH variable of Windows, then start it by double clicking the Com2Websocket.jar file. Alternatively, you can also change the path to the ‘java.exe’ file of your Java installation in the file ‘runme.bat’ of the COM2WebSocket tool and then run it by a double click on the ‘runme.bat’ file. In the COM2WebSocket application window, select the virtual COM port number that belongs to your SiRad Easy® and select 230400 baud as the baudrate like shown in Figure 9. A click on the ‘connect’ button opens a WebSocket server, which is fed with the data coming from the SiRad Easy®. Proceed to Section 2.2.4 for running the graphical user interface.
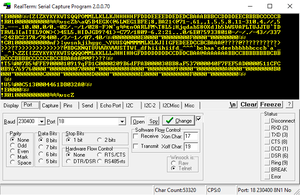
Connecting to the Evaluation Kit via terminal program instead of WebGUI (optionally) Optionally, you can connect to this serial port using a terminal program such as PuTTY or Realterm instead of the Com2WebSocket Tool and WebGUI. Use the following UART settings: 230400 baud, 8 bits, 1 stop bit, no flow control. You should see plenty of protocol output from the SiRad Easy® like in Figure 9 .
SiRad Simple®
The sensor board can be connected to a PC via USB through an FTDI cable (delivered with the evaluation kit), which provides a virtual COM port. We recommend using a cable with FTDI chipset instead of cheaper alternatives since a lot of our customers found the cheaper alternatives to be very unstable. If you want to use a cheaper alternative, skip the next point and see the vendor’s website of your cable.
Installing the FTDI driver
Usually the driver is automatically installed by Microsoft Windows once the FTDI cable is connected to the PC. Therefore, the PC has to be connected to the internet and the automatic driver installation feature has to be enabled (default behavior). If you need to install the driver manually, go to the FTDI Chip website and download the latest VCP driver. Once the FTDI driver is installed, the FTDI cable connected to the sensor and to the PC should provide a virtual COM port.
Installing the Evaluation Kit’s COM2WebSocket tool
The Evaluation Kit software contains a COM2WebSocket tool that creates a WebSocket from the virtual COM port to provide it to the graphical user interface. You can find the tool in the Install Package in the ‘Software’ folder. The COM2WebSocket tool is portable and can be copied to a path of your choice on your PC. Make sure that the java.exe of your Java JRE or SDK installation is available in the PATH variable of Windows, then start it by double clicking the Com2Websocket.jar file. Alternatively, you can also change the path to the ‘java.exe’ file of your Java installation in the file ‘runme.bat’ of the COM2WebSocket tool and then run it by a double click on the ‘runme.bat’ file. In the COM2WebSocket application window, select the virtual COM port number that belongs to your sensor board and select 230400 baud as the baudrate like shown in Figure 7. A click on the ‘connect’ button opens a WebSocket server, which is fed with the data coming from the sensor board. Proceed to Section 2.2.4 for running the graphical user interface.
Connecting to the Evaluation Kit via terminal program instead of WebGUI (optionally)
Optionally, you can connect to this serial port using a terminal program such as PuTTY or Realterm instead of the Com2WebSocket Tool and WebGUI. Use the following UART settings: 230400 baud, 8 bits, 1 stop bit, no flow control. You should see plenty of protocol output from the sensor like in Figure 7
4.2.3 Connecting to the Board via WiFi
SiRad Easy®
Please be aware that the WiFi module has a limited transfer rate. The maximum possible frame update rate is about 10 Hz when using the WiFi connection. Once you power-up the SiRad Easy® in WiFi configuration, the WiFi module’s LED is flashing in blue. The WiFi module opens an own access point. This may last approximately 40 seconds. Please set the WiFi module of your PC to use automatic IP address selection via DHCP to get an IP address from the SiRad Easy®. If your PC’s WiFi module uses a static IP, it might not be possible to connect to the WiFi module of the SiRad Easy®. Connect to the SiRad Easy®’s WiFi access point using the following login credentials:
SSID: EasyRadar Password: Greetings
Once the SiRad Easy®’s WiFi module has opened an access point, it waits for approximately 40 seconds until it starts the sensor operation and the blue LED is switched off. On Windows, the IP address that was assigned by the SiRad Easy®’s WiFi module to your PC can be checked in the network manager. Proceed to Section 2.2.4 for running the graphical user interface.
SiRad Simple®
Please be aware that the WiFi module has a limited transfer rate. The maximum possible frame update rate is about 10 Hz when using the WiFi connection. Once you power-up the sensor module in WiFi configuration, the WiFi module’s LED is flashing in blue. The WiFi module opens an own access point. This may last approximately 40 seconds. Please set the WiFi module of your PC to use automatic IP address selection via DHCP to get an IP address from the sensor. If your PC’s WiFi module uses a static IP, it might not be possible to connect to the WiFi module of the sensor. Connect to the sensor’s WiFi access point using the following login credentials:
                                      SSID:  SimpleRadar-<uuid>		                                       Password:  SimpleRadar
                             or
                                      SSID:  EasyRadar				                               Password:  Greetings
Once the sensor’s WiFi module has opened an access point, it waits for approximately 40 seconds until it starts the sensor operation and the blue LED is switched off. On Windows, the IP address that was assigned by the sensor’s WiFi module to your PC can be checked in the network manager. Proceed to Section 2.2.4 for running the graphical user interface.
4.2.4 Starting the Graphical User Interface (Silicon Radar WebGUI)
SiRad Easy®
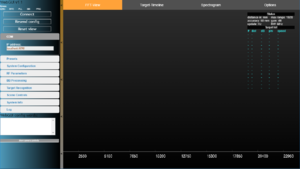
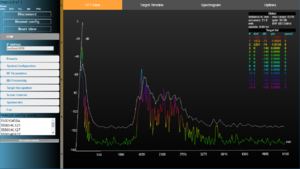
You can find the Silicon Radar WebGUI in the Install Package in the ‘Software’ folder. It is portable and can be copied to a path of your choice on your PC. The user interface is started by opening the ‘startEasy.html’ file in a Chrome or Firefox Webbrowser. Once the WebGUI is launched, the main window is displayed, also see Figure 10 (left). WiFi only: If you are using a WiFi connection to connect to the Evaluation Kit, unfold the ‘COM’ section in the control panel on the left side of the WebGUI. Provide the IP address and the port of the WiFi module of the SiRad Easy® you want to connect to before you proceed, like so: ‘192.168.4.1:9090’. The standard port is 9090. Click the ‘Connect’ button on the top left to connect to the WebSocket provided by the COM2WebSocket tool or to the WiFi module of the Evaluation Kit. The WebGUI should display the sensor data as shown in Figure 10
SiRad Simple®
You can find the Silicon Radar WebGUI in the Install Package in the ‘Software’ folder. It is portable and can be copied to a path of your choice on your PC. The user interface is started by opening the ‘startSimple.html’ file in a Chrome or Firefox Webbrowser. Once the WebGUI is launched, the main window is displayed, also see Figure 8 (left). WiFi only: If you are using a WiFi connection to connect to the sensor board, unfold the ‘COM’ section in the control panel on the left side of the WebGUI. Provide the IP address and the port of the WiFi module of the sensor you want to connect to before you proceed, like so: ‘192.168.4.1:9090’. The standard port is 9090. Click the ‘Connect’ button on the top left to connect to the WebSocket provided by the COM2WebSocket tool or to the WiFi module of the sensor board. The WebGUI should display the sensor data as shown in Figure 8
4.3 Firmware
4.4 Firmware Update
SiRad Easy®
4.4.1 Microcontroller Board
To update or change the microcontroller firmware, the board has to be connected to the PC via the USB port. It opens a new mass storage device called NODE_F303RE. Just drag and drop the .bin file you want to flash on that device. LD1 on the board starts flashing red and green. As soon as the flashing stops, the board is programmed and after a reset the new firmware should be running. Alternatively, you can use the ST-LINK Utility (STSW-LINK009) to flash the firmware on the microcontroller board. You can find the firmware in the folder ‘Firmware\SiRad_Easy’ of the provided Install Package:
- <date>_SiRad_Easy_L7_<version>.bin for the kit bought after 10/2016,
- <date>_SiRad_Easy_L8_<version>.bin for the kit bought before 11/2016.
If you are unsure, which firmware version is appropriate for your hardware, please contact support@siliconradar.com
4.4.2 WiFi Module
Connect the SiRad Easy® using a USB to UART cable like shown in Figure 39 using the external header. Please read Section 2.1.2 about the external header connection. Then connect cable TX to WR (WiFi RX) and cable RX to WT (WiFi TX). Make sure to use a cable with 3.3V TTL levels! Switch SW1 to the PROG position.
Find and install the esptool in the Firmware folder of the provided Install Package. Copy the firmware from the ‘Firmware\WiFi_Module\websocket_mini’ folder of the Install Package into the esptool folder. Edit the batch file esptool.bat and replace the COM port with the COM port of your USB to UART cable and the firmware name with the desired firmware, marked here:
esptool -bz 1M -cp COMx -cf websocket_mini.ino.generic.bin
Run the batch file and the WiFi module gets programmed, indicated by a flashing blue LED. After about 40 seconds programming is finished. Switch SW1 back to the ON position and connect a jumper between MT and WR and MR and WT.
4.4.3 USB Controller Firmware
Download and extract the ST-LINK firmware update tool (STSW-LINK007) from the ST Microelectronics website. Go into the ‘AllPlatforms’ folder and start the .jar file. Connect the SiRad Easy®, click ‘Refresh device list’ and then ‘Open in update mode’ to see the current USB controller firmware. Click ‘Upgrade’ to flash it to the latest version.
SiRad Simple®
4.4.4 Microcontroller
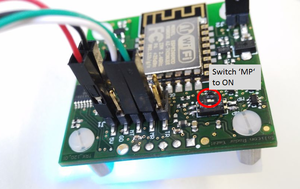
To update or change the microcontroller firmware, the board has to be set in bootloader mode, as shown in Figure 36. This is done by switching the DIP switch called MP to the ON position. Then connect the module to the PC via a USB to UART cable using the external header. Please read Section 2.1.1 about the external header connection. Connect cable TX to MR (microcontroller RX) and cable RX to MT (microcontroller TX). Make sure to use a cable with 3.3V TTL levels! Find and install the flash tool stm32flash in the Firmware folder of the provided Install Package. Copy the desired firmware from the ‘Firmware\SiRad_Simple’ folder of the Install Package into the stm32flash folder. Edit the batch file stm32flash.bat and replace the COM port with the COM port of your USB to UART cable and the firmware name with the desired firmware, marked here:
stm32flash.exe -b 115200 -w <date>_SiRad_Simple_L8_<version>.bin -v -g 0x0 COMx
Run the batch file and the microcontroller gets programmed. After about 30 seconds the programming is finished. Switch the DIP switch MP back to the OFF position and do a power cycle to reset the module. You can find the firmware <date>_SiRad_Simple_L8_<version>.bin in the provided Install Package in the folder ‘Firmware\SiRad_Simple’.
4.4.5 WiFi Module
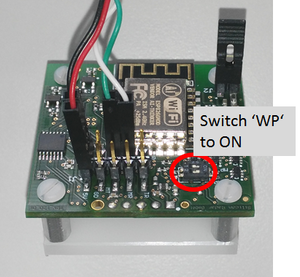
Connect the sensor using a USB to UART cable like shown in Figure 37 using the external header. Please read Section 2.1.1 about the external header connection. Switch the DIP switch called WP to the ON position. Then connect cable TX to WR (WiFi RX) and cable RX to WT (WiFi TX). Make sure to use a cable with 3.3V TTL levels! Now connect the power Jumper J2 to enable the supply voltage for the WiFi module.
Find and install the esptool in the Firmware folder of the provided Install Package. Copy the firmware from the ‘Firmware\WiFi_Module\websocket_mini’ folder of the Install Package into the esptool folder. Edit the batch file esptool.bat and replace the COM port with the COM port of your USB to UART cable and the firmware name with the desired firmware, marked here:
esptool -bz 1M -cp COMx -cf websocket_mini.ino.generic.bin
Run the batch file and the WiFi module gets programmed, indicated by a flashing blue LED. After about 40 seconds programming is finished. Switch the DIP switch called WP back to the OFF position and connect a jumper between MT and WR and MR and WT.
4.5 WebGUI
4.3.1 Getting Started with the Silicon Radar WebGUI.
4.3.1.1 Understanding the User Interface.
The SiRad Easy ® Evaluation Kit is developed to demonstrate the functionality of Silicon Radar’s trans ceiver chips as millimeter wave distance and velocity sensor front end s. Once the WebGUI is launched, the main window is displayed like shown on the right.
The Silicon Radar WebGUI consists of four main panels:
- control panel on the left side,
- main menu on the top of the screen with the active view in orange,
- scene/canvas itself where the sensor data is displayed,
- target list with the status fields on the right side of the screen (draggable).
The control buttons on the top left corner are used to connect the WebGUI to the SiRad Easy®.
Connect: used to connect the WebGUI to the WebSocket provided by the Com2WebSocket tool,which should be started before connecting the WebGUI.
Resend config: used to send the current settings to the SiRad Easy® . Usually, the settings made in the WebGUI will immediately take effect on the SiRad Easy® , however, this feature is useful when a SiRad Easy® was reset or re connected.
Reset view : resets the view area to use the maximal available window space for displaying the data and centers the view in the view area.
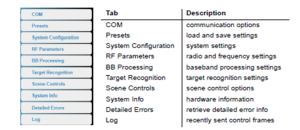
4.3.1.2 Using the Control Panel (Sensor Settings).
The control panel on the left side of the WebGUI provides the controls for the user interface. It is used to connect to the Evaluation Kit , to send commands and to change the data view. The control panel contains the sections shown in figure below.
Communication Options (COM Tab)
The standard setting ‘localhost: is for communication via the USB port, see Figure 13 (left). If you are using WiFi, type in the IP address and the port 9090 of the SiRad Easy® ’s WiFi module like in Figure (below), for example, 192.168.4.1:9090.
Load and Save Settings (Presets Tab)
Load predefined settings: You can load predefined settings via the dropdown box in the ‘Presets tab, see Figure 14 (left). Choose a setting and p ress ‘Load’. Afterwards go to the ‘ System Configuration’ tab and choose ‘SER 2 if you use the USB connection instead of WiFi The factory presets are explained figure below.
Save own settings: To save your settings, click the ‘New’ button . The dialog in Figure below appears. Enter a preset name and description for your settings and click ‘Save ’’. All set tings are stored as cookies in your browser so that they are available next time when you open the browser. Please make sure that your browser saves and keeps cookies (Mozilla Firefox) or local storage is enabled (Chrome Browser) to enable th is feature. Do not use a ‘ private mode and do not set up your browser to delete all saved content each time you close the window.
Delete settings: To delete settings, choose a preset name and click ‘Delete’. In case you accidentally delete d one of the factory presets, those will be automatically restored next time you open the browser.
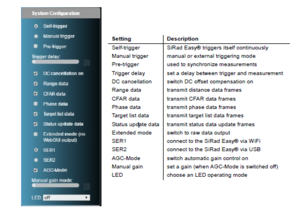
System Settings (System Configuration Tab)
The ‘System Configuration’ tab shown in Figure below is used to control the kind and amount of transmissions from the SiRad Easy®.
- Triggering measurements
You can choose between the two triggering modes ‘Self triggering’ and ‘Manual triggering’. You can find the steps to set them in Table on the right.
Self trigger: activates the continuous measurement mode (default) The SiRad Easy® triggers itself repeatedly for continuous measurements.
Manual trigger: deactivates the continuous measurement mode for manual external triggering. Use this setting for asynchronous triggering or synchronized measurements between multiple radar sensors . The SiRad Easy® enters a low power mode after the transmission of measurement results and wakes up upon the next trigger. Also see the Protocol Description for manual trigger commands.
Pre-trigger: can be used to synchronize measurements between multiple radar sensors. If selected and the SiRad Easy® is not in self trigger mode, the SiRad Easy® expects two external trigger commands to execute one measurement. The two triggers have to be sent with a maximum delay of about 40ms or the second trigger is ignored. Also see the Protocol Description for the trigger commands.
Trigger delay: sets a delay time between two measurements when in self trigger mode.
- Frame options
DC cancellation : activates the DC offset compensation of the ADC data.
Range data : activates the transmission of the distance data frames, which contain the distance spectrum data in dB for each distance bin (magnitude of the complex FFT output).
CFAR data: activates the transmission of the CFAR data frames, which contain the threshold of the constant false alarm rate (CFAR) operator in dB for each distan ce bin. The CFAR operator is an adaptive algorithm to derive detection threshold for targets against noise.
Phase data: activates the transmission of the phase data frames, which contain the values of the phase angles for each distance bin (argument of the complex FFT output).
Target list data: activates the transmission of the target list data frames, which contain a list of targets including a target number, distance to the target, and their magnitude in dB and their phase. The speed field is reserved.
Status update data: activates the transmission of the status data update frames after every measurement. If deactivated, the status frame is only transmitted after the Evaluation Kit settings changed. The status frame contains the distance unit (default: mm), the current maximum range of the Evaluation Kit, the measurement accuracy of the current setting, the gain setting of the baseband amplifier for the last measurement, the update rate of the Evaluation Kit and the bandwidth of the frequency ramps used in the current setup.
Extended mode: activates the transmission of the extended data frames (raw instead of the standard data frames. Please be aware that the extended data frames are not supported by the WebGUI. No data will be shown in the WebGUI as l ong as the extended data mode is enabled. Please see the Protocol Description for more information about the ‘Extended mode’.
- Connection control
SER 1: connect to the SiRad Easy ® using the WiFi module.
SER2: connect to the SiRad Easy ® using the USB port.
Please note that, if the wrong connection option is selected, the WebGUI will appear to be frozen because no data will be displayed. However, the SiRad Easy® always listens on both serial ports, so econfiguring is possible at any time.
- Gain settings
AGC Mode: activates the automatic gain control. If activated, the SiRad Easy® uses two extra frequency ramps to detect and set the optimal gain setting. When AGC Mode is turned on, the settings of the gain slider are overridden by the automatic gain control.
Gain: used to manually set one of 4 gain levels. The gain control is only used when the AGC Mode is switched off. There are 4 gain modes, which depend on the hardware version of the baseband board due to adaptations in the attenuation network and ADC lines o f the baseband amplifier. The gain settings for the latest SiRad Easy® baseband board (v 1.3 ) are 8, 21, 43, 56 dB (left to right).
- LED control
LED: switch es the LED on or off. If switched on, the LED indicates the distance to the first detected target in rainbow colors.
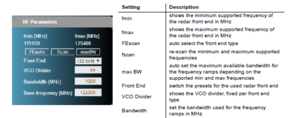
Radar Front End Settings (RF Parameters Tab)
The ‘RF tab’ is used to control the radar front end of the Evaluation Kit. For each radar measurement, the front end is driven with one or more frequency ramps starting from a defined start frequency f1 (base frequency) to a higher frequency f2 with the bandwidth BW = f2 - f1. The higher the bandwidth, the smaller is the detection range of the SiRad Easy® due to Nyquist limitations. The start frequency is technically limited by the minimum frequency f min supported by the front end. The bandwidth is limited by the maximum frequency f max supported by the front end. Please note, that in most countries, the permitted bandwidth is regulated by law to 250 MHz between 24 GHz and 24.25 GHz and to 1 GHz between 122 GHz and 123 GHz for field applications. Please check your local regulations.
fmin / fmax : displays the result of the frequency scan (done once automatically during startup) to find the minimum and maximum supported frequencies of the installed radar front end (f min and f max). The scan can be performed manually by using the ‘fscan’ feature.
FEauto : performs a manual scan of the mounted front end to determine the frequency range and basic front end settings (this feature is of less importance for the SiRad Simple® due to the fixed front end).
fscan: performs a manual min / max frequency scan for the installed front end . The frequencies supported by your front end should be approximately in the range of 23300 to 26200 MHz for the 24 GHz front end and 119100 to 125900 MHz for the 122 GHz front end.
max BW: sets the frequency ramp bandwidth to the maximum possible value for the installed front end The maximum bandwidth is hardware dependent and may vary. The maximum useful bandwidth BW is (including a margin of 200 MHz): BWmax = (fmax – 100 MHz) – (fmin + 100 MHz).
Front End: switches the presets for the used radar front end.
VCO Divider: is hardware dependent per front end type The VCO divider for the SiRad Easy ® front ends are 8 for the 24 GHz front end and 64 for the 122 GHz front end.
Bandwidth: set the bandwidth (in MHz) used for the frequency ramps. The bandwidth should not exceed the maximum frequency f max of the front end minus the minimum frequency fmin of the front end minus 200 MHz.
Base frequency: set the start frequency of the frequency ramps (in MHz). The start frequency fB should be at least 100 MHz larger than the minimum supported frequency fmin of the front end, and at least 100 MHz smaller than the maximum supported frequency of the front end fmax minus the desired bandwidth. If the base frequency and bandwidth are chosen in a way that the bandwidth exceeds the minimum and maximum supported frequencies of the front end, the voltage applied to the VCO for the voltage ramp may drive into saturation, which decreases the signal quality.
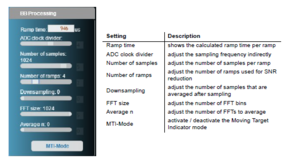
Baseband Processing Settings BB Processing Tab)
The ‘BB tab shown’ in the Figure left is used to control the baseband processing of the SiRad Easy® to tune the SNR, accuracy, or processing speed.
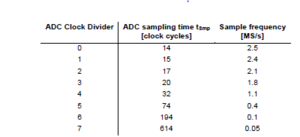
Ramp time: is reported back by the SiRad Easy®. The ramp time t is calculated using the selected sampling time tSmp, the number of samples nSmp and the clock frequency of the ADCs, like t [us] = tSmp [clock cycles] * (nSmp + 85) / (36 MHz). The sampling time tSmp is an internal value that is controlled by the ADC Clock Divider setting according to Table below. The sample frequency fSmp is determined by the clock frequency of the ADCs (36 MHz) divided by the ADC sampling time tSmp.
ADC clock divider: sets the sampling time of the ADCs indirectly. A higher ADC clock divider means slower sampling.
Number of samples: sets the number of samples taken per ramp.
Number of ramps: sets the number of ramps that are driven per measurement. All ramps are integrated to improve the SNR. Hence, higher values give slower measurements but better SNR. However, too many ramps may smear out the signal due to the phase noise of the system.
Downsampling: determines how many samples are averaged after sampling. Higher downsampling values improve the accuracy but reduce the maximum range of the SiRad Easy® Voids are filled with zeroes when downsampling. A downsampling of 0 means no downsampling, 1 means an averag e of 2 values, 2 an average of 4 values, etc.
FFT size: sets the number of FFT bins . Higher values mean better accuracy but slower calculation.
Average: determines the number of FFTs to average . An average of 0 means 1 FFT without averaging, 1 means an ave rage of 2 FFTs, etc.
MTI: Mode activates the Moving Target Indicator mode. When activated, the SiRad Easy® displays the difference between the current measurement and the average of the previous measurements (set by the ‘Average slider).
Target Recognition Settings (Target Recognition Tab)
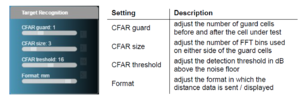
The ‘Target Recognition’ tab is used to control the CFAR operator for the target recognition and the reported distance format / unit. The CFAR operator is explained in below sections. We use a simple CACFAR operator that calculates the average from the reference cells for the CFAR.
Scene Control Options (Scene Controls Tab)
You can control the scene with the settings shown on the ‘Scene Control’ tab shown in left
Radar Hardware Information (System Info)
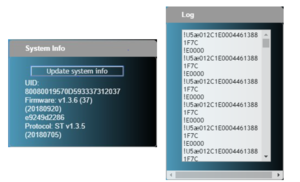
The System Info tab shows the unique hardware identification number of the SiRad Easy®, the firmware version, date of compilation, version identifier, and protocol version and specification date. You can press the ‘Update system info’ button to refresh this information from the sensor.
Recently Sent Control Frames (Log)
The Log tab which lists the latest control frames sent to the SiRad Easy® . Also see the Protocol Description for further information about the SiRad Easy®’s communication protocol.
4.3.1.3 Using the Main Menu
Here you can select how the data should be displayed. You have the following main options , which are explained in the following subsections
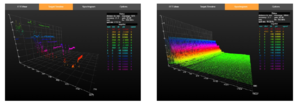
- FFT View: FFT (2D) and Water fall (3D)
- Target Timeline
- Spectrogram
- Options
FFT View
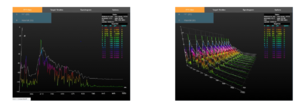
- FFT (2D ) chart: The x axis shows the distance and the y axis shows the magnitude in dB at this distance.
- Waterfall (3D ) chart: In the 3D view you can see the history of data, with the z axis being the timeline. Older values move to the back (higher z values). The x and y axes behave like in the 2D view.
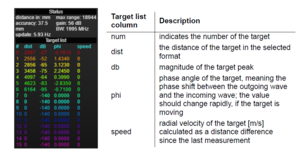
Status Field and Target List
The ‘Status’ field displays a couple of useful information about the current measurements.
- distance: shows the used distance format of the SiRad Easy® , for example, [mm, cm, bins].
- max range: current max. measurement range of the SiRad Easy® in the chosen distance format.
- accuracy: the width of one distance bin of the SiRad Easy® after the formula acc = c * nSmp / (2 * BW * n FFT * 2 ndown, where c is the speed of light, BW is the bandwidth, nSmp is the number of samples, nFFT is the FFT size, and n down is the downsampling factor.
- gain: current gain setting of the baseband amplifier in dB.
- BW: the chirp’s bandwidth.
- update: calculated update rate from the TSLM value („time since last measurement“).
The ‘Target list, is ordered by distance. With every new measurement having the CFAR operator enabled, the ‘Target list is updated. Where the distance bin crosses the CFAR threshold from below, the local maximum is searched and a target is generated. If two or more target peaks cross the CFAR threshold from below before the distance bin goes back underneath the CFAR threshold, only the first target is marked.
Target Timeline
The ‘Target Timeline’ shows the magnitudes of past targets. The x axis shows the distances of the targets and the y axis shows the magnitudes of the targets in dB. The z axis shows the timeline of the data. Older values move to the back (higher z values).
Spectrogram
The ‘Spectrogram ’is another time dependent display of distance data.
Options
In the ‘Options’ menu, you can choose the coloring of the data between:
- Magnitude
- Range / target number
- Phase angles ( the phase angles are only colorized if the magnitude is larger than 120 dB and when the Phase frame transmission is enabled in the ‘System Configuration’ Tab)
- No coloring
There is also an additional option to display phase markers above the detected targets. These markers show the phase angle of the detected target. The phase angle is very sensitive to sligh t changes of the target distance within one distance bin. It can be used to display relative motion in the µm range.
4.3.1.4 Understanding the Configuration Info Field
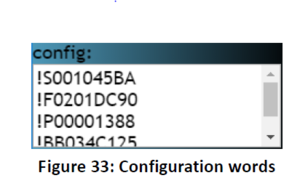
The config field shows the configuration that was send by the WebGUI to the SiRad Easy® on connect. Those config words are further explained in the protocol description.
4.3.1.5 Camera Controls
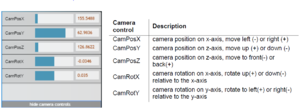
Click on the bar in the bottom left to show the camera controls. Here you can see and change the camera position and rotation of the view relative to the specified axis. The camera view can be changed using the mouse within the scene area. A left click drag pans the camera position. A right click drag changes the camera view angle. A middle click drag or moving the mouse wheel changes the zoom setting (z coordinate) of the camera.
4.3.1.6 Understanding the Error Info Field
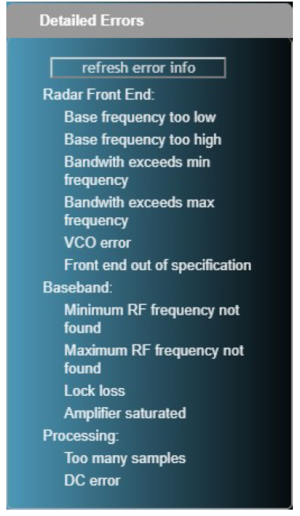
Temporary errors are indicated in yellow. Temporary errors are errors that are raised during processing but will be auto corrected when the error disappears. The Detailed Errors Panel shows the full error explanation. You can retrieve the full error information by clicking the refresh error info button.
4.3.1.7 Understanding the Data View
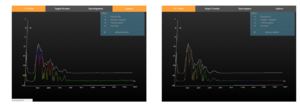
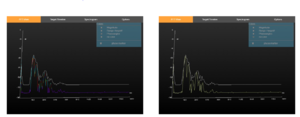
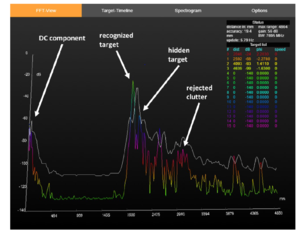
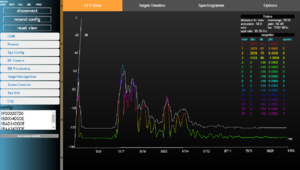
The figure shows a typical spectrum output of the SiRad Easy® when placed on a tabletop and looking to the ceiling. Viewing a radar target spectrum for the first time might be confusing for the beginner. However, with some practice, it is easy to find targets and understand why some things work while others might not.
Targets: The first ceiling echo is a round 2 0 0 cm, which should be quite high versus the neighboring noise floor. Using a lens will make this target peak thinner and higher and more easily detectable by the CFAR operator. The next targets are around 260 cm, 410 cm, and 460 cm. Due to the adaptive nature of the CFAR operator it might happen that if two targets are too near to each other or are very different in magnitude, one of them is rejected ( by the CFAR operator, such a target may be hidden around 220 cm . Changing the target recognition settings might help in this situation.
DC component: There is some DC component on the left side. If this DC offset is high, it might trigger a false target detection of the CFAR operator.
Clutter: Around 290 cm to 330 cm there might be some clutter which is rejected by the CFAR operator.
4.3.2 I cannot store presets in the Preset tab.
Please make sure you are not working in the private mode of your browser and you have enabled cookies, since the presets are stored as cookies.
4.3.3 I cannot see any output in the WebGUI window.
SiRad Easy®
Please first set the SiRad Easy® up for the USB connection. For that, check if the jumper J5 on the microcontroller board is set to the U5V setting, if all jumpers are removed from the external header of the baseband board, and if the dip switch SW1 on the SiRad Easy® baseband board is set to the OFF position according to section 2.1 of the User Guide. If not, please unplug the SiRad Easy®, adjust the settings, and plug it in again. Also check the USB cable connection and if your device is powered properly. Then go to the ‘System Configuration’ tab and chose SER2 for the USB connection. You can also toggle the ‘Close’ and ‘Open’ button of the Com2WebSocket tool without closing the WebGUI and see if that helps. Lastly, you can start over, close all WebGUI / Webbrowser and Com2WebSocket windows, disconnect the SiRad Easy® and start over with connecting the SiRad Easy®, connecting the Com2WebSocket tool and connecting the WebGUI.
SiRad Simple®
Please first set the SiRad Simple® up for the USB connection. For that, check if the two dip switches on the SiRad Simple® are set to the off position and if the jumpers are set according to Section 2.1 of the User Guide. If not, unplug the sensor, adjust the settings, and plug it in again. Also check the FTDI cable connection and if your device is powered properly. Then go to the ‘System Configuration’ tab and chose SER1, regardless whether you are using a WiFi or UART onnection. The SER2 option is reserved for our SiRad Easy® Evaluation Kit. You can also toggle the ‘Close’ and ‘Open’ button of the Com2WebSocket tool without closing the WebGUI and see if that helps. Lastly, you can start over, close all WebGUI / Webbrowser and Com2WebSocket windows, disconnect the SiRad Simple® sensor and start over with connecting the sensor, connecting the Com2WebSocket tool and connecting the WebGUI.
4.3.4 The spectrum output jumps (partly).
SiRad Easy®
First, if you are not using the WiFi connection, disable the WiFi module by switching the dip switch SW1 to the OFF position. Sometimes it is necessary to turn the AGC-Mode off in the ‘System Configuration’ tab and manually choose one of the 4 gains using the gain slider. Further, you can try to manually set and increase the base-frequency in 100 MHz steps to see if that stabilizes the output.
SiRad Simple®
First, if you are not using the WiFi connection, disable the WiFi module by disconnecting the power jumper J2. Sometimes it is necessary to turn the AGC-Mode off in the ‘System Configuration’ tab and manually choose one of the 4 gains using the gain slider. Further, you can try to manually set and increase the base-frequency in 100 MHz steps to see if that stabilizes the output.
4.3.5 How does the Auto Gain Control (AGC)-Mode work?
The AGC algorithm uses the first two ramps of each measurement to elaborate the highest gain setting without saturating the ADC or the baseband amplifier. In each of the two ramps the controller samples two gain stages while switching on an attenuation network during the first ramp. After that, the controller has 4 gain settings to choose from for the subsequent measurement.
4.3.6 Can I trigger the SiRad Evaluation Kit manually?
Yes. Please read the User Guide section about the triggering options.
4.3.7 Can I use multiple SiRad Evaluation Kits in parallel?
Yes. You can synchronize the Evaluation Kits using the pre-trigger feature. We suggest either driving them in different frequency ranges so they do not interfere, or you trigger them manually to measure alternately. Please read the User Guide section about the triggering options.
4.3.8 The LED goes off when I connect to the WebGUI.
This is because the WebGUI sends a different configuration to the evaluation kit when it is connected. The LED will light again when the proper serial port is set in the ‘System Configuration’ tab and the LED mode is changed from off to 1st target rainbow.
SiRad Easy®
SER1 for WiFi connection, SER2 for USB connection
SiRad Simple®
SER1 for the SiRad Simple®
4.3.9 The RF Parameters tab does not show the min / max frequencies properly.
You can try a manual min / max frequency scan by clicking the ‘fscan’ button.
4.3.10 How do I choose a base-frequency?
The base frequency should be at least 100 MHz above the minimum frequency and far away from the maximum frequency. For small bandwidths, you may choose the base frequency 500 MHz or more above the minimum frequency for an improved signal quality. Please be aware, that in most countries the base frequency has to bet set between 24 GHz and 24.25 GHz or 122 GHz and 123 GHz for production purposes by law. Please check your local regulations.
4.3.11 How do I set the maximum bandwidth in the RF Parameters tab?
Click the ‘max BW’ button to set the maximum possible bandwidth for the front end.
4.3.12 How do I choose a bandwidth?
The smaller the bandwidth, the greater will the range of the SiRad evaluation kit become. However, with larger bandwidths the accuracy will decrease. Please be aware, that in most countries the bandwidth is limited to 250 MHz between 24 GHz and 24.25 GHz and 1 GHz between 122 GHz and 123 GHz for production purposes by law. Please check your local regulations.
4.3.13 How can I choose the ramp time?
The ramp time can only be set indirectly by adjusting the ADC clock divider and the number of samples, please also see the WebGUI section of the User Guide.
4.3.14 What is the MTI-Mode?
The Moving Target Indicator mode. When activated, the evaluation kit displays the difference between the current measurement and the average of the previous measurements (set by ‘Average n’ slider).
4.3.15 There are too many targets. The CFAR operator does not work.
You may experience that there are no targets detected by the CFAR operator although there are plenty of targets visible in the FFT output. If there are too many targets adjacent to each other in the field of view, the CFAR operator may treat those targets like noise floor and calculates an envelope around those targets. Increasing the number of guard cells may help in such a scenario.
4.3.16 How is the distance information calculated?
All calculations are done on the microcontroller on the evaluation kit, so that the reported target distance is already in millimeters. The distance formula used is d = nBin * acc, where d is the distance to the target, nBin is the FFT bin of the target, and acc is the accuracy.
4.3.17 The update rate of the SiRad Evaluation Kit is very low. How can I improve it?
The update rate is dependent on the chosen parameters in the ‘BB Processing’ tab, in particular, on the ramp time, number of samples, number of ramps, and FFT size. Further, the amount of data that has to be transferred is important. You can select the transmitted frames in the ‘System Configuration’ tab. Using only the target list output, the evaluation kit can reach about 50 Hz update rate.
4.6 MIMO GUI
This section is under construction. We will come back with more information soon. Thank you for your patience.
Silicon Radar Support Team
4.7 Terminal Program
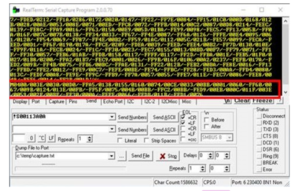
Once the SiRad Evaluation Kit is plugged in, it begins sending standard data. The standard data is transmitted in blocks of different data frames that are tied together in a single transmission, as highlighted in below. In the figure, two data blocks are marked red. Each data block ends with ASCII value 32 (‘ ‘, space) as stop markerand can contain multiple data framesof different size. In the example in below, the data locks contain 5 data frames each. One data frame in the upper block is marked blue. Each data frame starts with ASCII value 33 (‘!’) as start marker and ends with two ASCII command characters (‘CR’ and ‘LF’)as stop marker.
You can use a terminal program to send the command strings as, for example, shown in Figure 16with the Realterm terminal program. Calculate the command string by converting the command bits, an example is shown in Figure 14,into hex format, shown in figure below. Use zeros for any RESERVED fields.
4.7.1 How to send commands using a terminal program
Add the start marker ‘!’ and the frame identifier (S, F, P, B) to the front of the hex command to form the command string. In case of the special function commands just use the start marker ‘!’ and the command identifier (I, J, K, L, M, N) as the command string. In case of the example in Figure above, you would receive the command string
!S000049BA
In case of a special function command, it could look like this!MPaste the command string into one of the send fields like shown in figure below, activate CR and LF to let Realterm add the stop markers to the string automatically, and then click ‘Send ASCII’.
4.8 Octave / Matlab
Can you help me to set up the device for the use with MATLAB / Octave?
A description how you can set up and import raw ADC data into MATLAB / Octave can be found here:
4.9 Output Modes
How can I configure the RAW data output mode?
Please see this site:
4.10 Sample Configurations
| Product | Configuration Description | Script |
|
EvalKit SiRad Easy |
Configures DC cancelled and unwindowed RAW ADC data output from analog I and Q channels, set 100 ms line delay while sending by your favorite terminal program |
{!S01113A0A} |
|
EvalKit SiRad Easy |
Configures non DC cancelled and unwindowed RAW ADC data output from analog I and Q channels, set 100 ms line delay while sending by your favorite terminal program |
{!S01113A02} |
|
EvalKit SiRad Easy |
Guide on how to change unwindowed RAW ADC data parameter settings |
{!S01113A0A} |
|
EvalKit SiRad Easy |
Configures DC cancelled and windowed RAW ADC data output from analog I and Q channels, set 100 ms line delay while sending by your favorite terminal program |
{!S01103A0A} |
|
EvalKit SiRad Easy |
Guide on how to change windowed RAW ADC data parameter settings |
{!S01103A0A} |
4.11 Processing
This section is under construction. We will come back with more information soon. Thank you for your patience.
Silicon Radar Support Team
4.12 Tuning & Speed up
This section is under construction. We will come back with more information soon. Thank you for your patience.
Silicon Radar Support Team
5 Design your Sensor
5.1 Firmware Development Guidelines
This section is under construction. We will come back with more information soon. Thank you for your patience.
Silicon Radar Support Team
5.1.1 Requirements
This section is under construction. We will come back with more information soon. Thank you for your patience.
Silicon Radar Support Team
5.1.2 Hardware Configuration Guidelines
This section is under construction. We will come back with more information soon. Thank you for your patience.
Silicon Radar Support Team
5.1.3 C Library
We provide example C source code files for our Evalkit Sirad Easy to help you developing your own application includes project and small example application and driver files for ADC, PLL, radar front end, baseband board and more, development environment (needed tools): System Workbench (Eclipse) by ST, STM32CubeMX by ST, F3 v1.9.0 MCU package for STM32CubeMX by ST. Please visit our Customer Download Area.
5.2 Schematics
We only share our schematics with our customer and an NDA needs to be signed to have our Schematics, please contact to our sales team.
5.3 Mechanic Drawings
This section is under construction. We will come back with more information soon. Thank you for your patience.
Silicon Radar Support Team
6 FAQ
Not able to find your problem here or your problem did not solved by above suggestions? We strongly suggest you to read the FAQs, Protocol Description and User Guides (in the download area) as they can be the answer most of your questions.


